
What Is VWAP?
In the NBA, a player’s stats mean nothing without context. Scoring 22 points sounds impressive, until you learn the league average that night was 28. Context changes everything. The number alone is not the signal. The number relative to the benchmark is the signal.
VWAP, Volume Weighted Average Price, is the financial market’s equivalent of that benchmark. It is the single most important intraday price level that institutional traders, algorithms, and market makers reference when deciding whether a stock is trading at a fair price, a discount, or a premium.
Every day, trillions of dollars in orders are executed using VWAP as a reference point. When you learn to read it, you stop guessing and start trading with the same information the biggest players in the market are using.
The VWAP Formula, What It Actually Calculates
VWAP is not a moving average. It is not a simple price average. It is a volume-weighted average, meaning every price print is weighted by how many shares traded at that price. A price level where 10 million shares traded carries far more weight than a level where 100,000 shares traded.
The formula:
VWAP = Cumulative (Price × Volume) ÷ Cumulative Volume
More precisely, for each bar:
Step 1, Calculate the Typical Price for each period:
Typical Price = (High + Low + Close) ÷ 3
Step 2, Multiply Typical Price by Volume for that period:
TP × Volume = Price-Volume
Step 3, Accumulate both values from the market open:
Cumulative TP×V = Sum of all (TP × Volume) since open Cumulative Volume = Sum of all Volume since open
Step 4, Divide:
VWAP = Cumulative TP×V ÷ Cumulative Volume
What this means in plain English: VWAP tells you the average price at which every share has traded today, weighted by volume. It is the truest measure of where the market has agreed to transact, not just where price has been, but where money has actually changed hands.
Why Institutions Use VWAP, and Why You Should Care
This is the part most retail traders skip, and it is the most important context for understanding why VWAP works.
Institutional traders, mutual funds, pension funds, hedge funds, are measured against VWAP. If a portfolio manager needs to buy 5 million shares of AAPL, they cannot just market-buy 5 million shares at once. That would move the price against them and create massive slippage. Instead, they break the order into pieces and execute throughout the day, targeting an average fill at or below the day’s VWAP.
- Buying below VWAP = beating the benchmark = good execution
- Buying above VWAP = worse than the benchmark = poor execution
This creates a self-reinforcing dynamic: institutions buy dips toward VWAP and sell rallies toward VWAP, which makes VWAP act as a magnet for price throughout the trading day. It is not a coincidence that stocks frequently return to VWAP after extended moves away from it. That is institutions rebalancing their execution.
When you understand this, VWAP stops being a line on a chart and starts being a window into institutional order flow.
The Three VWAP Trading Setups
Setup 1, The VWAP Reclaim (Bullish)
A VWAP reclaim is one of the cleanest long setups in day trading. It occurs when a stock opens below VWAP or dips below it intraday, then fights back and reclaims it, closing a candle above VWAP with conviction.
Why it works: When price reclaims VWAP, buyers are now paying above the average institutional price for the day. Sellers who bought at VWAP are now in profit and less likely to sell. The path of least resistance shifts upward.
How to trade it:
- Stock dips below VWAP, do not buy yet
- Watch for a reversal candle (hammer, engulfing, or strong close) back above VWAP
- Wait for a full candle close above VWAP, not just a wick
- Enter on the next candle open, stop below the low of the reclaim candle
- Target: the high of day or the next resistance level
Real example: AMD opens at $165, gaps slightly below VWAP at $166.50. The first 30 minutes are choppy. At 10:15 AM, a large green candle forms and AMD closes back above $166.50 on elevated volume. RSI crosses above 50 simultaneously. That is your reclaim entry. Stop at $165.80, target $168.50.
Setup 2, The VWAP Rejection (Bearish)
The mirror image of the reclaim. A stock rallies up to VWAP from below, fails to hold it, and gets rejected back down. This signals that sellers at VWAP are dominant, they are defending the institutional benchmark.
How to trade it:
- Stock is trading below VWAP, bearish environment
- Price rallies up and touches VWAP from below
- A reversal candle forms at VWAP (shooting star, bearish engulfing, or failure to close above)
- Enter short on the next candle, stop above VWAP
- Target: the low of day or next support level
The key tell: Watch the tape at VWAP. If you see large red prints on the Time and Sales as price touches VWAP, institutions are selling the level. If the prints are small and sporadic, the rejection may not hold.
Setup 3, The VWAP Trend Trade (Riding the Band)
In a strongly trending day, think a big earnings gap or a sector momentum day, price does not oscillate around VWAP. It establishes itself clearly on one side and stays there.
- Price consistently above VWAP with every pullback finding support at or above it = strong uptrend. Buy every dip to VWAP.
- Price consistently below VWAP with every bounce failing at or below it = strong downtrend. Short every bounce to VWAP.
This is the most profitable VWAP setup on trending days and the most dangerous on choppy days. The filter: if price has crossed VWAP more than 3–4 times in the first hour, it is a choppy day, use the reclaim/rejection setups. If price has stayed cleanly on one side, it is a trending day, use the trend trade.
VWAP vs. Moving Averages, What’s the Difference?
Traders often ask why they should use VWAP instead of a simple moving average like the 9 EMA or 20 SMA. Here is the critical distinction:
| VWAP | Moving Average | |
|---|---|---|
| Calculation | Price × Volume, cumulative | Price only |
| Resets | Every trading day at open | Never (continuous) |
| What it measures | Where money actually transacted | Where price has been |
| Best for | Intraday trading | Swing and position trading |
| Institutional relevance | Extremely high | Low to moderate |
Moving averages treat every price tick equally. A print of 100 shares gets the same weight as a print of 500,000 shares. VWAP does not, it weights by volume, making it a far more accurate representation of where meaningful money changed hands.
For intraday trading, VWAP is superior to any moving average because it resets each day and reflects that day’s actual transaction history. For swing trading on daily charts, moving averages are more useful because VWAP is an intraday tool.
Anchored VWAP, The Advanced Version
Standard VWAP resets at the open every day. Anchored VWAP (AVWAP) lets you anchor the calculation to any meaningful price event, an earnings release, a major gap, a breakout from a multi-month base, and measure the volume-weighted average price from that point forward.
When to use anchored VWAP:
- After a major gap up or down, anchor to the gap day open
- After an earnings release, anchor to the earnings candle
- After a breakout from a multi-week consolidation, anchor to the breakout day
If price is holding above an anchored VWAP from a major catalyst, it tells you that the average buyer since that event is still in profit, a bullish structural condition. If price falls below it, the average buyer is now underwater, a bearish shift.
Anchored VWAP is available on TradingView, ThinkorSwim, and most professional platforms.
VWAP in Practice, A Full Day Trading Scenario
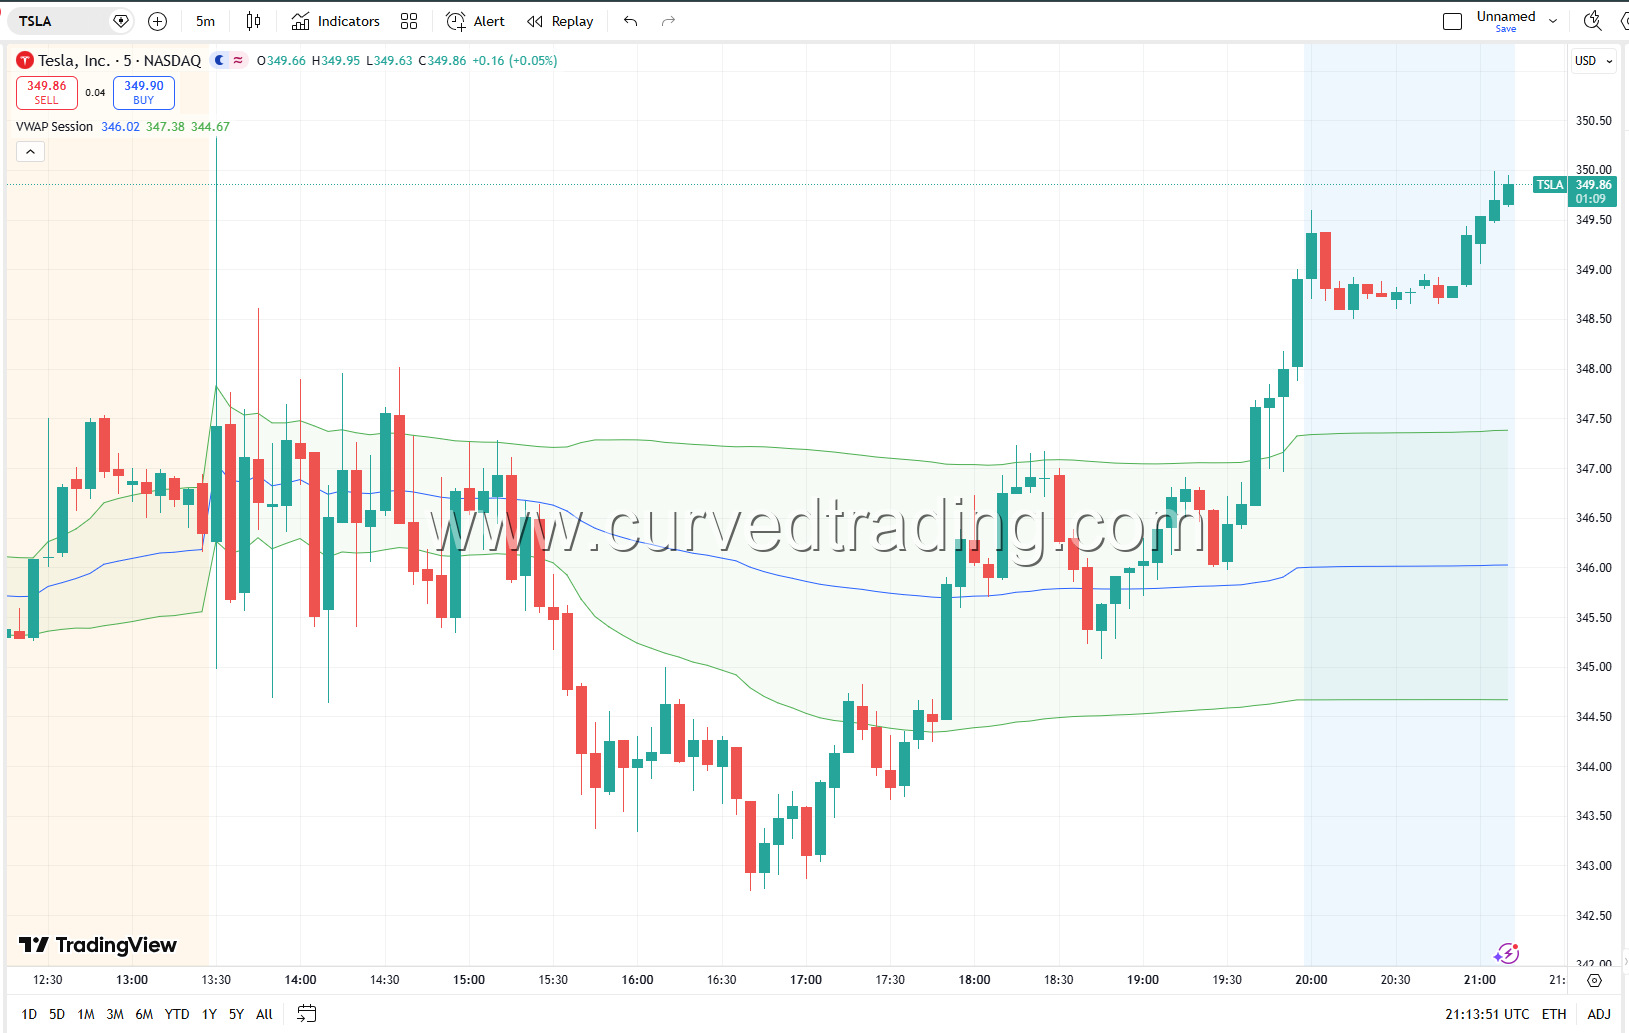
Scenario: You are watching TSLA on a 5-minute chart. Today is a moderate volume day, no major news.
Morning (9:30–10:00 AM): TSLA opens at $172, gaps below yesterday’s close. VWAP calculates at $173.20 by 9:45 AM. Price is choppy below VWAP. You do not trade, no setup yet.
Mid-morning (10:15 AM): TSLA pushes up to $173.10, just below VWAP. A hammer candle forms. The next candle closes at $173.40, above VWAP. Volume on that candle is 2.3× the average. RSI crosses 52.
Entry: Long at $173.45 (next candle open) Stop: $172.80 (below the hammer low) Target: $175.20 (high of day from yesterday)
11:00 AM: TSLA hits $175.10. You exit. The trade lasted 45 minutes. VWAP acted as the launch pad, not because of the line itself, but because institutions were defending that level.
Common VWAP Mistakes
Trading VWAP on low-volume stocks. VWAP is only meaningful when volume is sufficient for the weighting to matter. On a stock trading 50,000 shares a day, VWAP is noise. It shines on high-volume names, SPY, QQQ, AAPL, NVDA, TSLA, AMD.
Ignoring the time of day. VWAP signals in the first 30 minutes are unreliable, the calculation has too little data and volume is erratic. The strongest VWAP setups occur between 10:00 AM and 11:30 AM and again from 2:00 PM to 3:30 PM.
Using VWAP on daily or weekly charts. VWAP resets every day. It is an intraday tool. On a daily chart, it is meaningless. Use anchored VWAP for multi-day analysis.
Treating VWAP as a hard level. VWAP is not a brick wall, it is a zone. Price frequently wicks through it before confirming direction. Wait for candle closes, not intrabar touches.
Final Thought: Trade Where the Money Is
VWAP is not a retail trader’s tool that happens to work. It is an institutional benchmark that retail traders have learned to read. That distinction matters. When you buy a VWAP reclaim, you are not betting on a technical indicator, you are aligning yourself with the execution logic of the largest participants in the market.
They are buying below VWAP. They are selling above it. They are defending it as price approaches from below and rejecting it when it approaches from above. The line on your chart is a reflection of their orders.
Trade where the money is. VWAP shows you exactly where that is.