
What Is RSI? The Speedometer of Momentum
Every stock moves. The question experienced traders ask is not where a stock is, it is how fast it is moving and how long it can sustain that pace before exhaustion sets in.
The Relative Strength Index (RSI) is the answer to that question. Developed by J. Welles Wilder Jr. and introduced in his 1978 book New Concepts in Technical Trading Systems, RSI is a momentum oscillator that measures the speed and magnitude of recent price changes. It produces a single number between 0 and 100, and that number tells you whether a stock is gaining momentum, losing it, or running on fumes.
Think of it like a track athlete’s heart rate monitor. You don’t wait until the runner collapses to know they’re overextended, the monitor tells you their body is operating beyond a sustainable threshold before the breakdown. RSI is that monitor for price.
The Math Behind RSI, How It Is Actually Calculated
Most traders use RSI without understanding the formula. That is a mistake. The calculation tells you exactly what RSI is measuring and, more importantly, what its limitations are.
Step 1, Define the lookback period
The default RSI period is 14 bars, 14 candles on whatever timeframe you are using. On a daily chart, that is 14 trading days. On a 5-minute chart, that is 14 five-minute candles. Wilder chose 14 as the default; many traders shorten it to 9 for more sensitivity or lengthen it to 21 for smoother signals.
Step 2, Separate up days from down days
For each of the 14 periods, calculate the price change from close to close. Separate those into gains (up closes) and losses (down closes, expressed as positive numbers).
Step 3, Calculate Average Gain and Average Loss
For the first RSI calculation, take a simple average:
Average Gain = Sum of gains over 14 periods ÷ 14 Average Loss = Sum of losses over 14 periods ÷ 14
For every subsequent calculation, Wilder used a smoothed moving average (also called Wilder’s smoothing):
Average Gain = (Previous Average Gain × 13 + Current Gain) ÷ 14 Average Loss = (Previous Average Loss × 13 + Current Loss) ÷ 14
Step 4, Calculate the Relative Strength (RS)
RS = Average Gain ÷ Average Loss
Step 5, Normalize to a 0–100 scale
RSI = 100 − (100 ÷ (1 + RS))
What this means in plain English: If a stock closes up every single day for 14 days, the average loss is zero, RS approaches infinity, and RSI approaches 100. If it closes down every single day, average gain is zero, RS is zero, and RSI approaches 0. In practice, RSI oscillates between these extremes, spending most of its time between 30 and 70.
Reading RSI, The Three Signals That Matter
Signal 1, Overbought and Oversold Levels
The most widely taught RSI signal is the overbought/oversold threshold:
- RSI above 70 = overbought. The stock has risen rapidly. Buying momentum may be exhausting.
- RSI below 30 = oversold. The stock has fallen rapidly. Selling momentum may be exhausting.
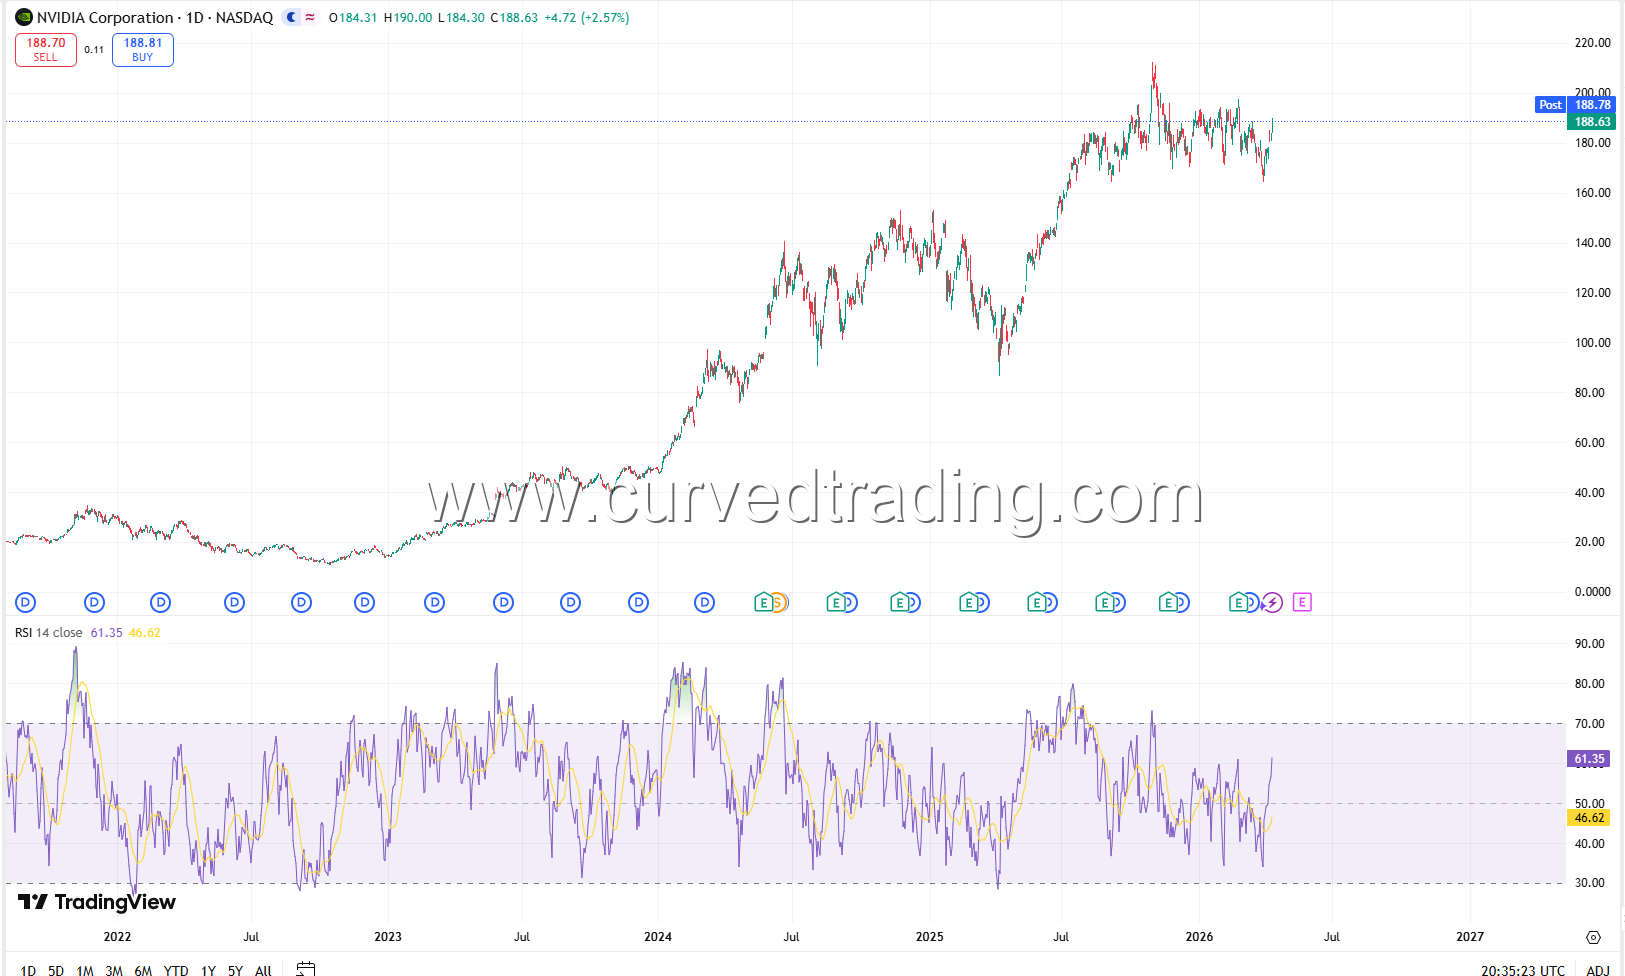
These are not automatic buy or sell signals. A stock can stay overbought through an entire uptrend, printing RSI readings of 75, 80, even 85 for weeks. During a strong bull run in NVDA or AAPL, RSI above 70 often means momentum is healthy, not time to short.
The correct interpretation: overbought means the stock is under stress. It does not mean the move is over. Wait for confirmation, a rejection candle, a failed higher high, or RSI crossing back below 70, before acting on it.
The same logic applies to oversold. RSI below 30 in a collapsing stock during a sector rotation or earnings miss is not a buy signal. It is a warning that selling is intense. Look for RSI crossing back above 30 as confirmation that the flush may be complete.
Signal 2, RSI Divergence
Divergence is the most powerful RSI signal and the most misunderstood.
Bearish divergence occurs when price makes a higher high but RSI makes a lower high. Price is still climbing. But the momentum engine driving it is losing power. The stock is running on fumes.
Bullish divergence occurs when price makes a lower low but RSI makes a higher low. Price is still falling. But sellers are losing intensity. Each wave down takes less energy than the last.
In both cases, divergence is a warning, not a trigger. Price can diverge from RSI for multiple candles before the reversal occurs. The setup becomes actionable when price confirms the divergence with a structural break, a breakdown of support in the bearish case, or a reclaim of a key level in the bullish case.
Real-world example: Imagine TSLA grinds from $200 to $240 over three weeks. On the first push to $220, RSI hits 72. On the rally to $240, RSI only reaches 65. Price made a higher high; RSI made a lower high. Bearish divergence. When TSLA then breaks the trendline it has been holding and RSI crosses below 50, that is your confirmation.
Signal 3, The 50 Centerline Cross
Less discussed but highly practical: RSI crossing above or below 50 is a momentum regime signal.
- RSI above 50: Bulls are in control. Average gains exceed average losses. Bias long.
- RSI below 50: Bears are in control. Average losses exceed average gains. Bias short.
Many professional traders use the 50 cross as a trend filter. They only take long setups when RSI is above 50, and only take short setups when RSI is below 50. It is a simple filter that keeps you on the right side of momentum.
RSI Settings, What to Change and When
The default 14-period RSI is designed for daily charts. When you change timeframes, consider adjusting the period:
- Scalping (1–5 min charts): RSI 7 or 9, faster signals, more noise
- Day trading (15 min–1 hour): RSI 14, standard, well-tested
- Swing trading (daily chart): RSI 14 or 21, smoother, fewer false signals
- Position trading (weekly chart): RSI 21, captures multi-week momentum cycles
The overbought/oversold thresholds can also be adjusted. In a strong trending market, consider widening them to 80/20 to avoid premature signals. In a choppy, range-bound market, tighten them to 60/40 to catch turns earlier.
RSI in Practice, A Day Trading Setup
Scenario: You are watching AMD on a 15-minute chart during a morning session.
- RSI drops to 28, oversold territory, as AMD flushes to a key support level at $165.00.
- A hammer candle forms at $165.00. Volume spikes on the low, then recedes.
- RSI crosses back above 30.
- You enter long on the next candle open with a stop below $164.50.
- Target: the first resistance at $167.50, where RSI approaches 60–65.
This is not a guaranteed setup. But it combines a structural level (support at $165), a price pattern (hammer), a volume signal (spike and fade), and an RSI confirmation (cross above 30). Four confluences. That is how RSI is meant to be used, as one layer of a multi-factor decision, not as a standalone trigger.
Common RSI Mistakes to Avoid
Treating overbought as an automatic sell. In trending stocks, RSI can stay above 70 for the entire duration of a move. Shorting NVDA because RSI hit 75 in February 2024 would have been catastrophic.
Using RSI in isolation. RSI without price structure context is noise. Always anchor your RSI read to what price is doing at a key level, support, resistance, a prior high or low.
Ignoring the timeframe. RSI divergence on a 1-minute chart is meaningless. RSI divergence on a daily chart, confirmed by weekly RSI turning down, is significant. Higher timeframes carry more weight.
Chasing the cross. By the time RSI visibly crosses 30 on a fast-moving stock, the first bounce may already be over. Learn to anticipate the cross by watching RSI approach the level and reading the tape simultaneously.
RSI vs. Other Momentum Indicators
| Indicator | What It Measures | Best Use |
|---|---|---|
| RSI | Speed of price change, 0–100 | Overbought/oversold, divergence |
| MACD | Trend + momentum via moving average crossover | Trend confirmation, momentum shifts |
| Stochastic | Close relative to high-low range | Short-term reversals |
| CCI | Distance from average price | Commodity cycles, overbought/oversold |
RSI is not superior to all of these in every context. MACD is better for trend-following entries. Stochastic is more sensitive for short-term mean-reversion plays. RSI is the most versatile because it is the simplest, a single number, cleanly bounded, with a universally understood scale.
Final Thought: RSI Tells You the Score, Not the Winner
The Relative Strength Index does not predict the future. It tells you the current balance of buying and selling pressure, how extreme that imbalance is, and whether it is growing or shrinking. That is enough, if you combine it with price structure, volume, and patience.
The traders who misuse RSI treat it as a crystal ball. The traders who profit from it treat it as a scorecard. Know the score, wait for the pattern to resolve, and size your position accordingly.
That is the edge.