Green Flag: What Is the Bull Pennant?
Lap 147 of the Daytona 500. Your driver has been threading the needle through traffic, drafting perfectly, and just made the most aggressive pass of the race to take the lead. He’s running the fastest lap times on the board. The crowd is on its feet. The momentum is his.
Then the caution flag drops. Pit stop.
The crew chief calls him in. Four tires. Fuel. Fifteen seconds. The car sits still while every other driver jockeys for position behind him. The commentators fill air time. The casual fans grab a beer. It looks like the race has paused.
But the driver knows better. The car is being reloaded. Fresh rubber. Full tank. And when the green flag drops again, he’s going to come out of the pits hotter than he went in, and gap the entire field.
That’s the bull pennant pattern.
On a chart, the bull pennant is a brief, triangular consolidation that forms after a sharp, high-volume move higher. The initial surge is the flagpole, your car screaming down the straightaway. The pennant itself is the pit stop, a tight, symmetrical compression where price coils on rapidly declining volume. And the breakout above the pennant is the green flag restart, full throttle, fresh fuel, and a clear track ahead.
This is not a reversal pattern. This is not indecision. The bull pennant formation is a continuation signal, the trend is catching its breath, not changing direction. And the traders who understand that distinction are the ones positioned to ride the next leg higher.
The Pit Crew’s Strategy: Why the Pennant Forms
Every race car needs to pit. You can’t run 500 miles on one tank. And the same is true for a stock in a strong uptrend, it can’t rally forever without pausing to consolidate.
Here’s what’s happening under the hood during the bull pennant pattern chart formation:
The Flagpole: Full Throttle
The pattern starts with a sharp move higher, the flagpole. This is a powerful, high-volume rally that catches the market’s attention. Think of it as your driver going from 12th place to 1st in ten laps. It’s aggressive. It’s decisive. And it puts everyone on notice.
The flagpole needs to be impulsive, a near-vertical move on expanding volume. If the rally is slow and grinding, it’s not a flagpole, it’s just a normal uptrend. The flagpole should feel urgent. Prints hammering the ask. Order flow overwhelmingly one-sided. Shorts scrambling to cover. This is the straightaway at 200 mph.
The Pennant: The Pit Stop
After the flagpole, price pulls back slightly and begins to consolidate in a tightening range. The highs get a little lower. The lows get a little higher. The two converging trendlines form a small symmetrical triangle, the pennant.
This is the pit stop. The engine is idling, not dead. The crew is working, not panicking. Volume drops dramatically during the pennant, and this is the single most important confirmation that the pattern is valid.
Why does volume matter so much? Because declining volume during the pennant tells you that the selling is not conviction-driven. Nobody is aggressively dumping shares. The traders taking profits from the flagpole rally are doing so casually, small lots, low urgency. Meanwhile, the institutional buyers who drove the flagpole are sitting on their positions, waiting for the consolidation to end before adding more.
The pit stop typically lasts 1-3 weeks on a daily chart. Any longer and the pattern loses its continuation energy, the tires have been on too long, the fuel is getting stale.
The Restart: Back to Full Throttle
The green flag drops. Price breaks above the upper trendline of the pennant on a surge of volume. The car screams out of the pits and back onto the track. The casual observers who thought the rally was over are now chasing. Shorts who faded the flagpole are covering in panic. And the patient traders who recognized the pit stop for what it was are sitting in their positions with a full tank of fuel.
The Spotter’s Guide: Reading the Pattern in Real Time
In NASCAR, every driver has a spotter, someone sitting above the track with a bird’s-eye view, calling out positions, gaps, and threats. Here’s how to spot the bull pennant trading pattern like a veteran spotter.
What Makes a Valid Flagpole
The flagpole should represent a move of at least 5-10% on a stock (more on small-caps, less on large-caps). It should happen over a few days to two weeks, fast enough to be impulsive but not a single-candle gap that has no structure. Volume on the flagpole should be well above the 20-day average. If it’s not, the rally doesn’t have the institutional backing needed to sustain a continuation.
The Pennant Must Be Tight
A valid pennant retraces no more than 30-40% of the flagpole. If the pullback is deeper, 50% or more, the pattern is degrading into something else. A bull flag pennant pattern comparison is useful here: flags are rectangular pullbacks, pennants are triangular. Both are continuation setups, but the pennant’s converging trendlines indicate an even tighter coil and typically produce a faster, sharper breakout.
The pennant should have at least four touches, two on each trendline. This proves the compression is real, not just random noise. Each touch narrows the range further. The car is in the pits, the lug nuts are coming off, the crew is working with precision.
Volume Tells the Story
Inside the pennant, volume should decline steadily, each day quieter than the last. Imagine the arena during a pit stop: the engines are off, the crowd murmurs, anticipation builds. If volume spikes inside the pennant with a sharp down-candle, that’s a red flag. That’s not a pit stop, that’s a mechanical failure. The pattern may be failing.
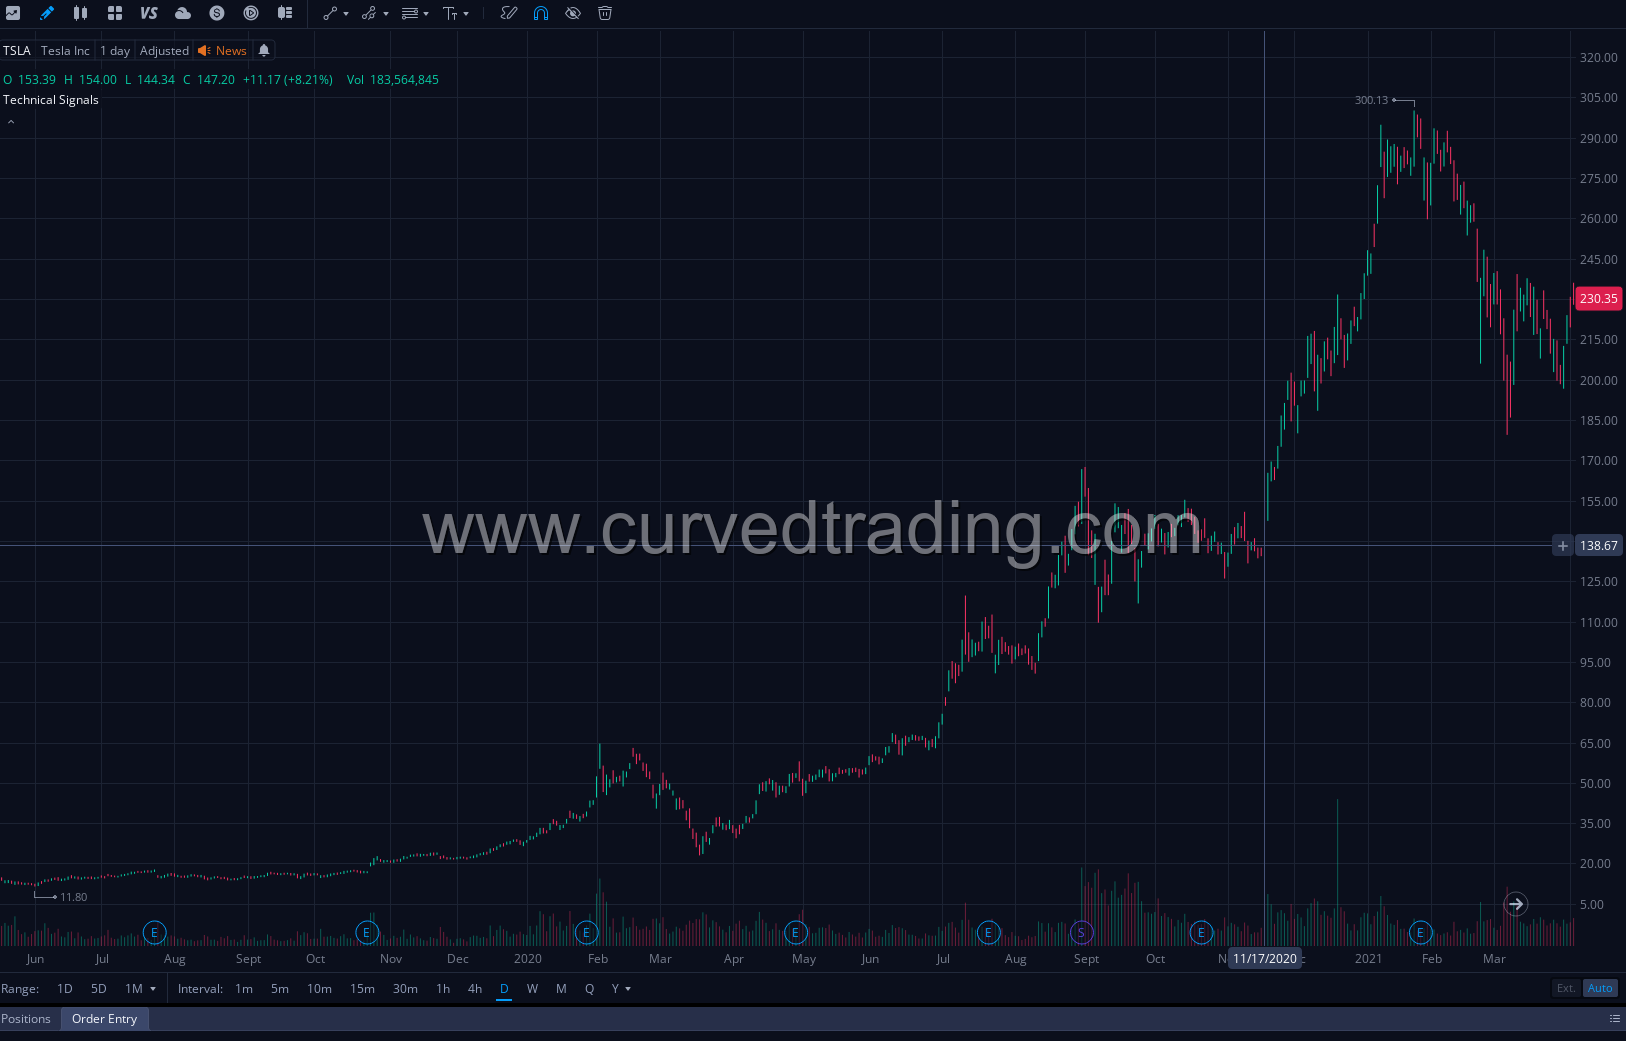
I Played this Pattern.
Pattern Structure: The pattern showed a rapid upward price movement (the “flagpole”) followed by a consolidated, narrower trading range (the “flag”). Context: This occurred as the market heavily allocated capital towards high-growth tech stocks in 2020, with TSLA exhibiting significant volatility and volume.
The Checkered Flag: The Breakout
The bull pennant breakout is the moment your driver exits pit road and merges back onto the track at full speed. Here’s what confirms the green flag is real:
Volume surge. The breakout candle must print on significantly higher volume than anything inside the pennant. Ideally, it should match or exceed the volume on the flagpole. This is the engine roaring back to life. Quiet volume on the breakout = the car stalled in the pits. Don’t chase it.
Clean break above the upper trendline. The candle body should close above the trendline, not just wick through it. A wick is a false start, the car lurched forward but the tires aren’t gripping. A full body close is clean exit speed.
Gap-and-go is ideal. The most powerful bull pennant breakouts gap above the pennant on the opening bell. This means overnight buying pressure was so strong that price skipped right past resistance. That’s your driver coming out of the pits a full second ahead of the field.
Bull Pennant Pattern Target
The measured move target for a bull pennant pattern is calculated by taking the length of the flagpole and projecting it upward from the breakout point.
Example: Stock rallies from $30 to $40 (flagpole = $10). The pennant forms between $38 and $40. Breakout at $40. Target = $40 + $10 = $50.
That’s the checkered flag. That’s where you plan to collect your trophy.
Bull Pennant Pattern Success Rate
The bull pennant pattern success rate is among the highest of all continuation patterns, historically breaking out in the expected direction roughly 65-70% of the time when volume confirmation is present. Without volume confirmation, that rate drops significantly. The volume is your engine. Without it, the car doesn’t move.
Caution Flags: What Can Go Wrong
The Mechanical Failure
If volume increases during the pennant with strong selling candles, the pattern is breaking down. The pit stop turned into an engine fire. Exit the position or don’t enter. The institutional support that drove the flagpole may be unwinding.
The Slow Pit Stop
If the pennant drags on beyond 3-4 weeks, it’s no longer a pennant, it’s becoming a range or a rectangle. The continuation energy dissipates. A pit stop that takes 45 seconds costs you the race. Speed matters in pennants.
The Fake Restart
Price breaks above the pennant on thin volume, runs for a candle or two, then reverses back inside. This is the equivalent of your driver coming out of the pits and immediately getting a flat tire. Wait for the volume. Wait for the clean break. Don’t jump the restart.
The Wrong Pattern Entirely
People confuse the bull pennant candlestick pattern with a wedge or a flag constantly. The key differences: a pennant is symmetrical (converging equally from both sides), a flag is a parallel channel, and a wedge has one side converging faster than the other. If your trendlines aren’t converging roughly equally, you’re not looking at a pennant.
The Victory Lap: Execution Checklist
Here’s your pre-race checklist before entering a bull pennant stock pattern:
Flagpole confirmed. Sharp rally, 5-10%+ move, above-average volume. The car was running fast before the pit stop.
Pennant is tight. Retracement less than 40% of the flagpole. Converging trendlines. At least four trendline touches. Duration 1-3 weeks.
Volume declining. Each day inside the pennant is quieter than the last. The engine is idling, not stalling.
Breakout with volume. Price closes above the upper trendline on volume that matches or exceeds the flagpole. The green flag is real.
Stop loss below the pennant’s lowest low. If the pattern fails, the pit stop became a retirement. Protect your capital.
Target = flagpole length above breakout. Measure your flagpole, add it to the breakout, and that’s your checkered flag.
This is where your Risk Management keeps you in the race. Size your position based on your stop distance. No all-in bets. Even the best driver doesn’t win every race. But the consistent ones finish on the podium all season.
The Post-Race Presser
The bull pennant pattern isn’t complicated. But it is precise. It demands a sharp flagpole, a tight pennant on declining volume, and a breakout that roars. Miss any one of those elements and you’re trading noise, not a pattern.
Think of it this way: the stock just ran a blistering pace. It pulled into the pits for a quick refresh. The crew did their job. And now it’s back on the track with fresh rubber and a full tank. The race isn’t over, the best laps are still ahead.
Read the volume. Measure the flagpole. Wait for the green flag. And when the breakout fires, put the pedal down.
See you in the winner’s circle.