
The Tee Box: What Is the Rounding Bottom?
Watch a pro golfer’s swing in slow motion.
The clubhead starts high, hands up, shoulders coiled, everything loaded with potential energy. Then the backswing begins. Slow. Controlled. The club sweeps downward in a smooth arc, accelerating gradually, reaching its lowest point just behind the ball. No jerking. No rushing. Just a patient, deliberate curve.
Then, contact. The clubhead meets the ball at the bottom of the arc and the energy transfers. The follow-through carries the club upward, higher than it started, the ball launching 300 yards down the fairway with that perfect crack that echoes across the course.
That’s the rounding bottom pattern.
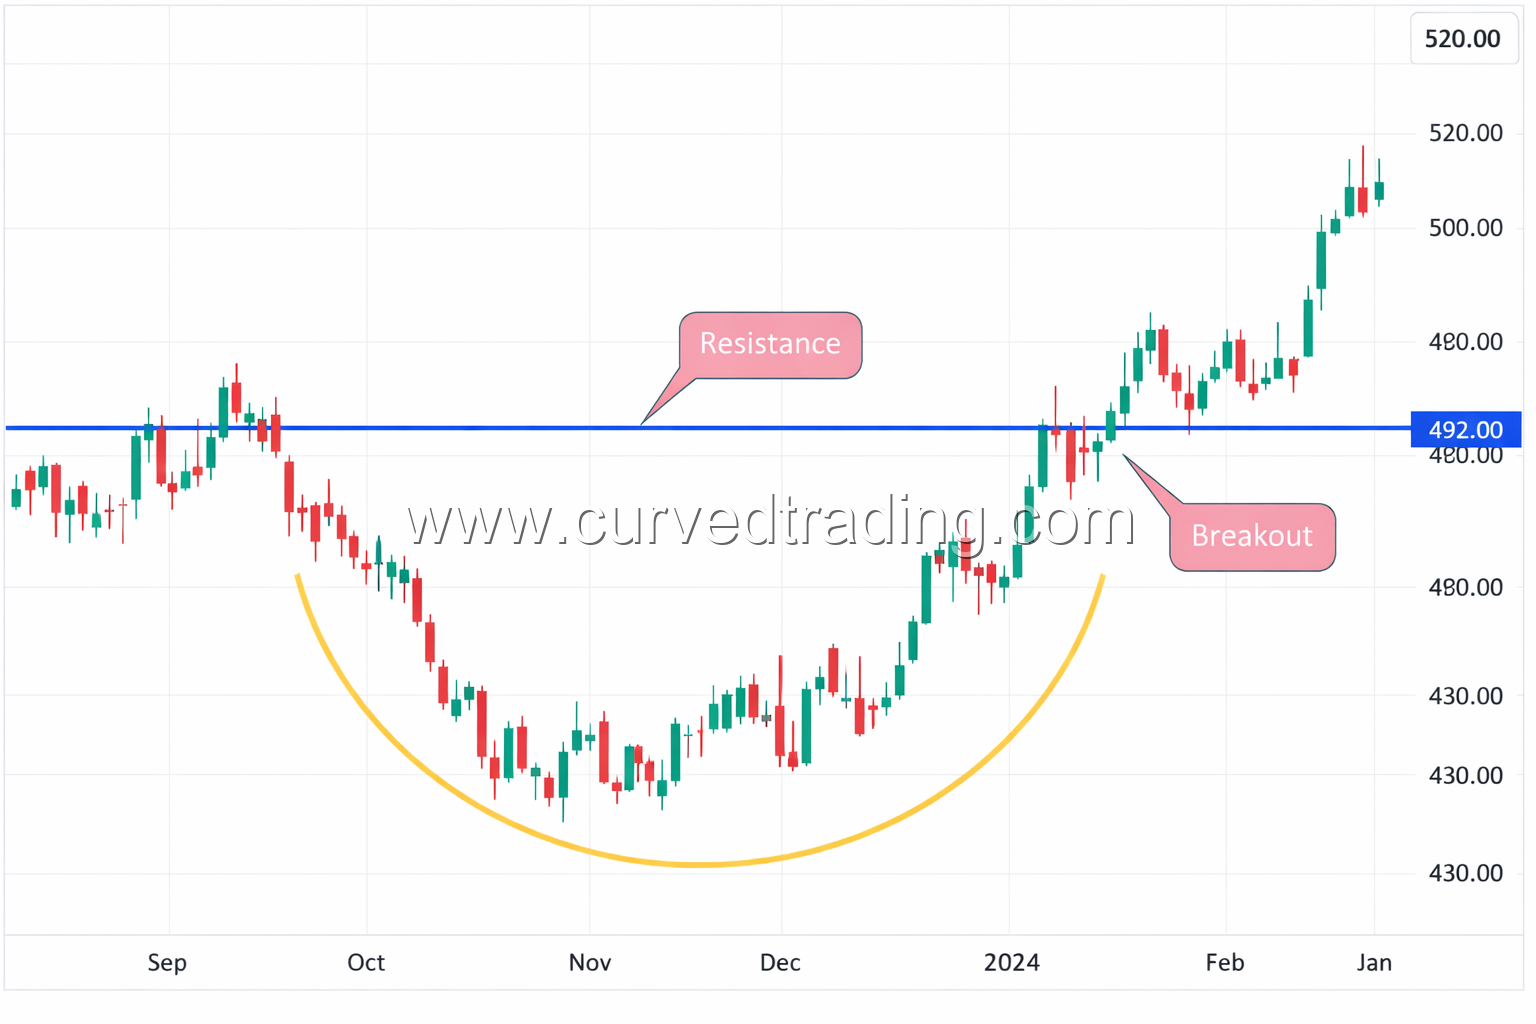
On a chart, the rounding bottom is a long, U-shaped reversal where price gradually declines, flattens out at the base, and then slowly curves back upward until it breaks above the neckline resistance. There are no sharp turns. No violent reversals. Just a smooth, arcing transition from sellers to buyers that builds momentum with every candle.
This is the most patient pattern in all of technical analysis. And just like a golf swing, you cannot rush it. The traders who try to force the entry before the arc completes are the weekend hackers who slice it into the trees. The ones who wait for the full swing to develop and the breakout to confirm are the ones who drop it on the green.
The Backswing: The Left Side of the Arc
Every rounding bottom chart pattern starts with a decline. But not a collapse. This isn’t a stock in freefall. This is a controlled backswing.
Price drifts lower over weeks or months. The selling is steady but not panicked. Volume is moderate and gradually declining as the stock moves down. Think of a golfer pulling the club back, smooth, controlled, building potential energy. There’s no urgency. The decline is methodical.
This is where most traders lose interest. The stock looks “boring.” It’s not crashing dramatically enough to attract short sellers and it’s not bouncing hard enough to attract dip buyers. Financial media ignores it. The casual observers have moved on to flashier tickers.
And that’s exactly what the pattern needs. The rounding bottom requires disinterest. It requires time. The left side of the arc is the market slowly forgetting about this stock while the ownership structure quietly changes hands from weak to strong.
What to look for: gradually declining volume as price moves lower. If the decline is happening on expanding volume, that’s not a backswing, that’s capitulation. The arc needs to feel lazy, not violent.
The Bottom of the Arc: The Sweet Spot
This is where the club reaches its lowest point. This is where the magic happens, and where patience is most critical.
The bottom of the rounding bottom pattern is a flat, extended base where price moves sideways in a narrow range. It can last weeks. Sometimes months. Volume drops to its lowest levels of the entire formation. The stock is dead quiet. Nobody is talking about it. Nobody cares.
This is the sweet spot of the swing, the moment of maximum stored energy, right before the transfer.
Here’s what’s happening technically: the last sellers are leaving. Every retail trader who was going to sell has already sold. Every impatient fund manager who needed to exit has exited. What remains are committed holders and, critically, institutional accumulators who are quietly building positions at the base. You’ll see it in the tape if you know where to look: steady bid-side absorption, dark pool prints, and blocks of shares changing hands without moving the price.
The bottom needs to be rounded and extended, not sharp. A V-shaped recovery is a different pattern entirely, that’s a stock bouncing on a catalyst. The rounding bottom is structural. The U-shape tells you that time has passed, conviction has shifted, and the entire supply-demand equation has been rewritten.
How Long Should the Bottom Last?
On a daily chart, the entire rounding bottom formation typically takes 3-6 months from the start of the left side to the breakout. The bottom itself, the flat base, usually accounts for 4-8 weeks of that. On a weekly chart, the pattern can develop over 6-18 months, and these longer formations produce the most powerful breakouts.
This is where the golf analogy is critical: you cannot rush the swing. A golfer who tries to speed through the bottom of the arc, who lifts the club too early or snaps their wrists, tops the ball. It dribbles 30 yards. The same thing happens with a rounding bottom that gets bought too early. The arc isn’t complete, the energy isn’t stored, and the breakout fizzles.
The Follow-Through: The Right Side Accelerates
Now the club is moving upward. And just like a golf swing, the right side of the rounding bottom should be faster than the left side.
Price begins to climb off the base. The lows get higher. The rallies get a little stronger. And, this is the key tell, volume starts to increase. Each push higher comes on more participation than the last. The crowd is re-engaging. The stock is back on watchlists. The institutional buyers who accumulated at the base are now adding on strength.
Think of the clubhead accelerating through the hitting zone. The backswing was slow and controlled. The bottom was the moment of transition. But the follow-through? That’s where the speed comes from. That’s where the energy releases.
Volume Is Your Swing Speed
In golf, clubhead speed determines how far the ball goes. In a rounding bottom, volume determines how powerful the breakout will be.
As price curves up the right side, you want to see a clear volume trend: each successive rally on higher volume than the last. This is your swing speed building. The club is accelerating through the arc. If volume stays flat or declines as price rises, the swing has no speed. The ball won’t carry. The breakout will likely fail.
Watch the order flow as price approaches the neckline (the resistance level established by the high before the pattern began). You want to see bids stacking, asks thinning, and tape speed increasing. The institutional buyers aren’t hiding anymore. They’re showing their hand because they know the breakout is coming.
The Drive: The Breakout
The ball is in the air. The breakout above the neckline of the rounding bottom pattern is the moment the swing connects, club meets ball, energy transfers, and price launches.
Here’s what confirms a legitimate breakout:
Volume surge. The breakout candle must print on the highest volume of the entire pattern. Higher than the left side, higher than the base, higher than anything on the right side. This is the crack of a perfect drive, you hear it before you see the ball fly. Without volume, the breakout is a topped shot.
Clean close above the neckline. The candle body needs to close above the resistance level, not just wick through it. A wick is a thin shot that clips the top of the ball. A full body close is a flush contact, center of the clubface.
No immediate reversal. The next 2-3 sessions after the breakout should hold above the neckline. Price can pull back and retest the neckline as new support, that’s normal, like the ball reaching peak height before settling onto the fairway. But if price immediately falls back below, the swing didn’t connect cleanly.
The Scorecard: Technical Execution
Reading the Green: Entry Strategy
Aggressive entry: Buy on the breakout candle as price closes above the neckline with volume confirmation. You’re betting the swing connected. Higher reward, higher risk of a false breakout.
Conservative entry: Wait for the retest of the neckline from above. The old resistance becomes new support. This is the ball bouncing on the fairway, it confirms the drive was clean. Lower risk, but you may miss the initial run if there’s no retest.
Early entry (advanced): Some experienced traders enter on the right side of the arc as volume begins to increase, before the official breakout. This is like reading the swing and knowing the contact will be clean before the ball launches. Higher risk, but the risk-reward is exceptional if the pattern completes.
The Hazard: Stop Loss Placement
Your stop goes below the most recent low on the right side of the arc, or for a wider stop, below the absolute bottom of the pattern. That’s the water hazard. If price falls back into it, the pattern has failed and the swing was a miss.
This is where your Risk Management keeps you on the course. Calculate position size based on entry-to-stop distance. Don’t over-leverage. Even Tiger Woods hits a bad drive sometimes, the key is that one bad hole doesn’t ruin the round.
The Pin: Price Targets
The rounding bottom pattern target is calculated by measuring the depth of the pattern, from the neckline down to the lowest point of the base, and projecting that distance above the neckline.
Example: Neckline at $50. Bottom of the arc at $35. Depth = $15. Target = $50 + $15 = $65.
That’s the pin. That’s where you’re aiming.
Scale out in thirds: first third at the nearest resistance level, second third at the measured move target, final third on a trailing stop. Don’t birdie the hole and then three-putt the next one. Protect your gains.
The Driving Range: Rounding Bottom vs. Other Patterns
Rounding Bottom vs. Cup and Handle
The rounding bottom and the Cup and Handle are close relatives, both are U-shaped bases. The difference: the Cup and Handle has a distinct “handle” (a small pullback before breakout), while the rounding bottom breaks out directly from the arc. The rounding bottom is the simpler pattern, one clean swing. The Cup and Handle adds a brief pause before the final move.
Rounding Bottom vs. Double Bottom
The Double Bottom is a “W”, two sharp tests of support. The rounding bottom is a “U”, one long, gradual curve. The Double Bottom is quicker and sharper. The rounding bottom is slower and smoother. Both are bullish reversals, but the rounding bottom requires significantly more patience.
Rounding Bottom vs. V-Bottom
A V-bottom is a sharp, catalyst-driven reversal, a stock that crashes and snaps back immediately. That’s not a swing, that’s a reflex. The rounding bottom pattern means a structural transition has occurred, weeks or months of gradual ownership change. V-bottoms are reactive. Rounding bottoms are intentional.
The 19th Hole: Scouting for Quality Setups
What Makes a Rounding Bottom Reliable
Duration. The longer the pattern takes to form, the more reliable the breakout. A 6-month rounding bottom on a weekly chart is an elite setup. A 2-week version on a daily chart is noise.
Volume signature. Declining volume on the left side and bottom, increasing volume on the right side, volume explosion on the breakout. This is the complete swing, slow back, accelerate through, explosive contact.
Symmetry. The right side should roughly mirror the left side in duration and angle. A severely lopsided pattern, where the right side is much steeper or shorter than the left, may lack the structural integrity needed for a sustained move.
Fundamental backdrop. The best rounding bottom stocks tend to be companies undergoing a genuine turnaround, improving earnings, new management, industry tailwinds. The chart pattern reflects the fundamental reality: the worst is over, and the recovery is underway.
Common Traps
Buying the bottom too early. The base can extend for weeks longer than you expect. Don’t enter until the right side shows rising volume and price is clearly curving upward. Patience wins in golf and in trading.
Ignoring volume. A rounding bottom that breaks out on weak volume is a topped drive. It might go 150 yards, but it’s not going 300. Wait for the volume surge or don’t enter.
Confusing it with a downtrend. Not every gradual decline is a rounding bottom forming. The key differentiator is the flattening at the base and the eventual upturn on rising volume. If price keeps making new lows with no base forming, that’s just a downtrend, walk to the next tee.
The Clubhouse: Final Thoughts
The rounding bottom pattern is the slow build that produces the longest drives. It requires more patience than any other pattern in the playbook, weeks and months of watching a stock do nothing while the ownership structure silently transforms beneath the surface.
But when the arc completes, when volume surges on the right side, when the neckline breaks on a volume explosion, when the follow-through carries price into new territory, the move that follows is one of the most powerful and sustained in all of technical analysis.
You can’t rush a golf swing. You can’t rush a rounding bottom. Let the arc develop. Watch the volume build. And when the club meets the ball, when the breakout fires with conviction, swing through.
Full follow-through. No deceleration. Trust the swing.
The course is open. The tee time is now. Review the film in the Discord and find your next setup.