
Round 1: What Is the Falling Wedge?
The crowd thinks the fight is over.
Your fighter has been backing up for three rounds. Every exchange pushes him closer to the ropes. The punches are coming from both sides, body shots, jabs, hooks, and the space to operate is shrinking with every second. The commentators are calling it. The betting line has shifted. Everyone in the arena sees a knockout coming.
Everyone except the fighter.
Because what they don’t see is this: the opponent’s punches are getting slower. The power is fading. Each combination lands with less conviction than the last. And the fighter on the ropes? He’s not hurt. He’s loading. He’s measuring distance. He’s waiting for the moment his opponent is completely gassed, and then he’s going to explode off the ropes with a counter that ends the fight.
That’s the falling wedge pattern.
On a chart, the falling wedge is a contracting price structure where both the highs and the lows are falling. But the lows are falling faster than the highs. The wedge narrows. The range compresses. It looks like a stock in freefall, squeezing into a tighter and tighter corner. But underneath the surface, selling pressure is drying up with every candle. The bears are punching themselves out.
When the compression finally breaks, when the upper trendline snaps, the move is explosive. The falling wedge breakout is the knockout counter. And if you know how to read the setup, you can be positioned before the crowd even realizes the fight has turned.
The Rope-a-Dope Setup: Why the Falling Wedge Is Bullish
Here’s what confuses most traders about the falling wedge chart pattern: it slopes downward. Everything about it looks bearish. Lower highs. Lower lows. A stock that appears to be bleeding out. So how is this a bullish setup?
The answer is in the compression.
Think about Muhammad Ali’s legendary Rope-a-Dope. When Ali leaned against the ropes and let George Foreman tee off on him, every ringside observer thought Ali was finished. But Ali understood something Foreman didn’t: every punch Foreman threw was draining his gas tank. The aggression was unsustainable. And when Foreman had nothing left, Ali came off the ropes and knocked him out.
The falling wedge works the same way. The sellers are Foreman, throwing everything they’ve got at the stock. But each selloff is weaker than the last. The lower boundary of the wedge is falling, yes, but it’s falling at a steeper angle than the upper boundary. That convergence tells you the selling is losing momentum. The bears are gassing out.
Meanwhile, the buyers are Ali. They’re absorbing the pressure. They’re not panicking. They’re bidding a little higher on each dip, that’s why the lows, while still falling, are falling more slowly relative to the highs. The order flow is quietly shifting from supply to demand, even as the chart screams weakness.
The MMA Ground Game: Anatomy of the Pattern
If boxing gives you the big picture, MMA gives you the grappling details. The falling wedge is a ground fight, and the bears think they have top position.
The Takedown: The Left Side of the Wedge
The pattern starts with a selloff. Price drops from a recent high, and the bears establish control. On the chart, you draw the first trendline connecting the lower highs and another connecting the lower lows. Both lines slope downward, but they’re converging, the channel is getting narrower.
In MMA terms, the bear has shot a double-leg takedown and is in top position. They’re working for a submission, throwing ground-and-pound. It looks dominant.
But look closer at the volume. On each successive push to new lows, volume is declining. The ground-and-pound is losing steam. The shots aren’t landing with the same force. The fighter on bottom isn’t taking real damage, he’s controlling wrists, framing, creating just enough space to survive.
The Scramble: The Compression Zone
As the wedge narrows, price action gets choppy and tight. The range between highs and lows shrinks. This is the scramble, both fighters tangled up, neither able to land a decisive blow.
What to look for here: declining volume is critical. If volume is flat or increasing as the wedge tightens, the pattern may fail. But if volume is steadily dropping, if each test of the lower boundary generates less selling interest, the setup is building. The bear is exhausting himself trying to finish the fight.
This compression phase is where weak hands exit. Retail traders see the lower highs and lower lows and sell. They don’t understand that the narrowing range is a coiling spring, not a collapsing floor. Every share they sell gets absorbed by patient institutional buyers who recognize the setup.
The Reversal: The Sweep to Top Position
In MMA, the most dramatic momentum shifts happen when the fighter on bottom times a sweep perfectly, using the opponent’s own momentum against him to reverse position. One second you’re being held down, the next you’re on top raining strikes.
That’s the breakout above the upper trendline of the wedge. The bears pushed and pushed and pushed, and suddenly they’ve got nothing left. The buyers sweep to top position. Price breaks the upper trendline on a surge of volume, the crowd erupts, the commentators lose their minds, and the fight has completely flipped.
The Knockout: The Breakout
The falling wedge breakout happens when price closes above the upper trendline of the wedge on strong volume. This is the knockout punch, Ali coming off the ropes, the ground fighter sweeping to mount.
Here’s what confirms a real breakout versus a fake-out:
Volume explosion. The breakout candle should print significantly higher volume than anything inside the wedge. If the breakout happens on quiet volume, it’s a feint, not a real punch. Don’t bite.
Decisive close above the trendline. You want a full candle body above the line, not just a wick poking through. A wick is a jab that didn’t land clean. A full body close is a hook that connected.
Follow-through. The next 2-3 candles after the breakout should hold above the trendline. If price immediately drops back inside the wedge, the sweep got reversed, back to the ground game. Reset.
The measured move target for a falling wedge breakout is the height of the wedge at its widest point, projected upward from the breakout. If the wedge spans $10 from its opening high to low, your target is $10 above the breakout level.
The Fight Card: Technical Execution
Your Corner: Entry Strategy
Aggressive entry: Buy the breakout candle as soon as price closes above the upper trendline with volume confirmation. This gets you in early but risks a false breakout.
Conservative entry: Wait for a retest of the broken trendline from above. The old resistance becomes new support, the fighter who just swept to top position confirming he’s not giving it back. This is the higher-probability entry but you may miss the initial move.
The Mouthguard: Stop Loss Placement
Your stop goes below the most recent low inside the wedge, the last low before the breakout. That’s your mouthguard. If price drops back below that level, the pattern is invalidated. The sweep failed, the bear is back on top, and you need to get out.
For tighter risk, place the stop just below the lower trendline at the point of breakout. Smaller risk per share, but more prone to getting clipped by normal volatility.
This is where your Risk Management system protects you. Size your position based on the distance from entry to stop. No exceptions. You don’t enter a fight without a game plan.
The Finish: Price Targets
Measured move: Height of the widest part of the wedge, added to the breakout point. This is your primary target, the knockout blow.
Example: Wedge forms between $60 (opening high) and $45 (opening low). Width = $15. Breakout at $52. Target = $52 + $15 = $67.
Scale out the same way you’d pace a fight: first third at the nearest resistance level, second third at the measured move, final third on a trailing stop. Don’t celebrate before the ref stops it.
The Judges’ Scorecard: Real vs. Fake Falling Wedges
Not every narrowing downtrend is a falling wedge pattern. Here’s how to score it properly.
Duration Matters
A legitimate falling wedge needs at least 3-4 weeks to form on a daily chart. Anything shorter is just normal price noise, a quick exchange of punches, not a sustained ground battle. On weekly charts, the pattern becomes even more reliable, typically forming over 2-6 months.
Volume Must Decline
This is the single most important confirmation. Volume inside the wedge should be trending lower. If volume stays elevated or increases as the wedge narrows, the selling isn’t drying up, the bear still has energy. Walk away.
At Least Five Touches
The wedge needs at least two touches on the upper trendline and two on the lower (three total minimum, five ideal). One bounce doesn’t make a pattern. You need repeated evidence that the compression is real, multiple scrambles, multiple failed submission attempts, before the sweep lands.
The Bullish or Bearish Question
People always ask: is a falling wedge pattern bullish or bearish? The answer is almost always bullish. Whether it appears in a downtrend (as a reversal) or in an uptrend (as a continuation), the falling wedge resolves upward roughly 68% of the time according to historical studies. The compression of selling pressure combined with quietly rising demand creates a structural bias toward an upside breakout.
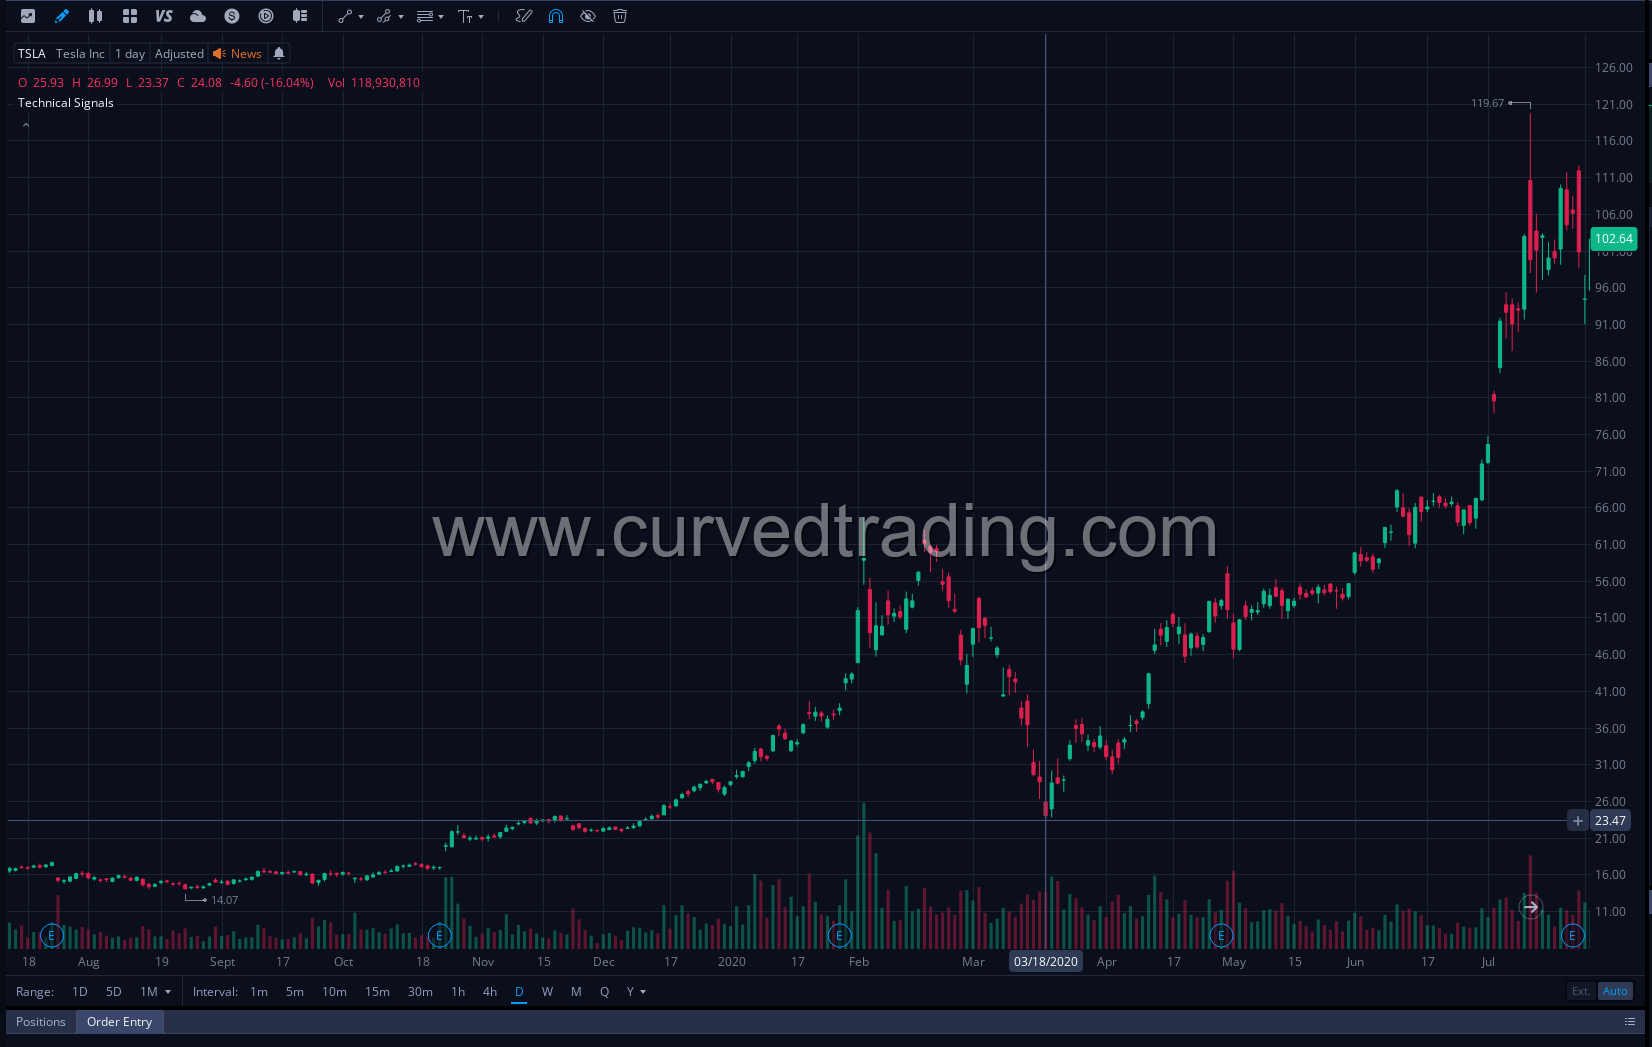
Tesla (TSLA): In 2020 I played this Tesla pattern. Tesla showcased a falling wedge pattern after a period of declining prices, which subsequently broke out to the upside and initiated a massive bull run.
The Post-Fight: Why This Pattern Pays
The falling wedge is the most misunderstood pattern in technical analysis because it requires you to buy what looks like weakness. Every instinct tells you to sell a stock making lower highs and lower lows. But the trader who reads the volume, who sees the compression, who understands that the sellers are punching themselves out, that trader is positioned for the knockout.
Ali didn’t win by throwing more punches than Foreman. He won by letting Foreman exhaust himself and then striking when the moment was right. The falling wedge is your Rope-a-Dope. The tighter the compression, the more violent the breakout. The quieter the volume inside the wedge, the louder the explosion when it breaks.
Read the tape. Watch the volume. Wait for the breakout. And when the upper trendline snaps on a volume surge, throw the counter. Decisively. No hesitation.
The fight film is in the Discord. Let’s break it down.