
Before You Read the Market, Learn to See It
Cristiano Ronaldo does not simply react to where the ball is. Before a pass is even made, he has already scanned the defensive line, catalogued the position of every midfielder, calculated the angle of the goalkeeper’s weight shift, and pre-committed to a run. He is not reading the ball, he is reading intent. He processes information layers most players ignore entirely, and that processing happens in fractions of a second.
Reading Level 2 market data is the financial equivalent of that skill.
Most retail traders stare at the ball, the candlestick, the price print, the moving average. Level 2 practitioners watch the entire pitch. They see where the money is leaning before the price moves there. The bid stack, the ask refresh rate, the size distribution, the tape velocity, these are the defenders, the midfielders, the space between lines. When you learn to read them together, you stop reacting to price and start anticipating it.
This guide is a masterclass in that skill.
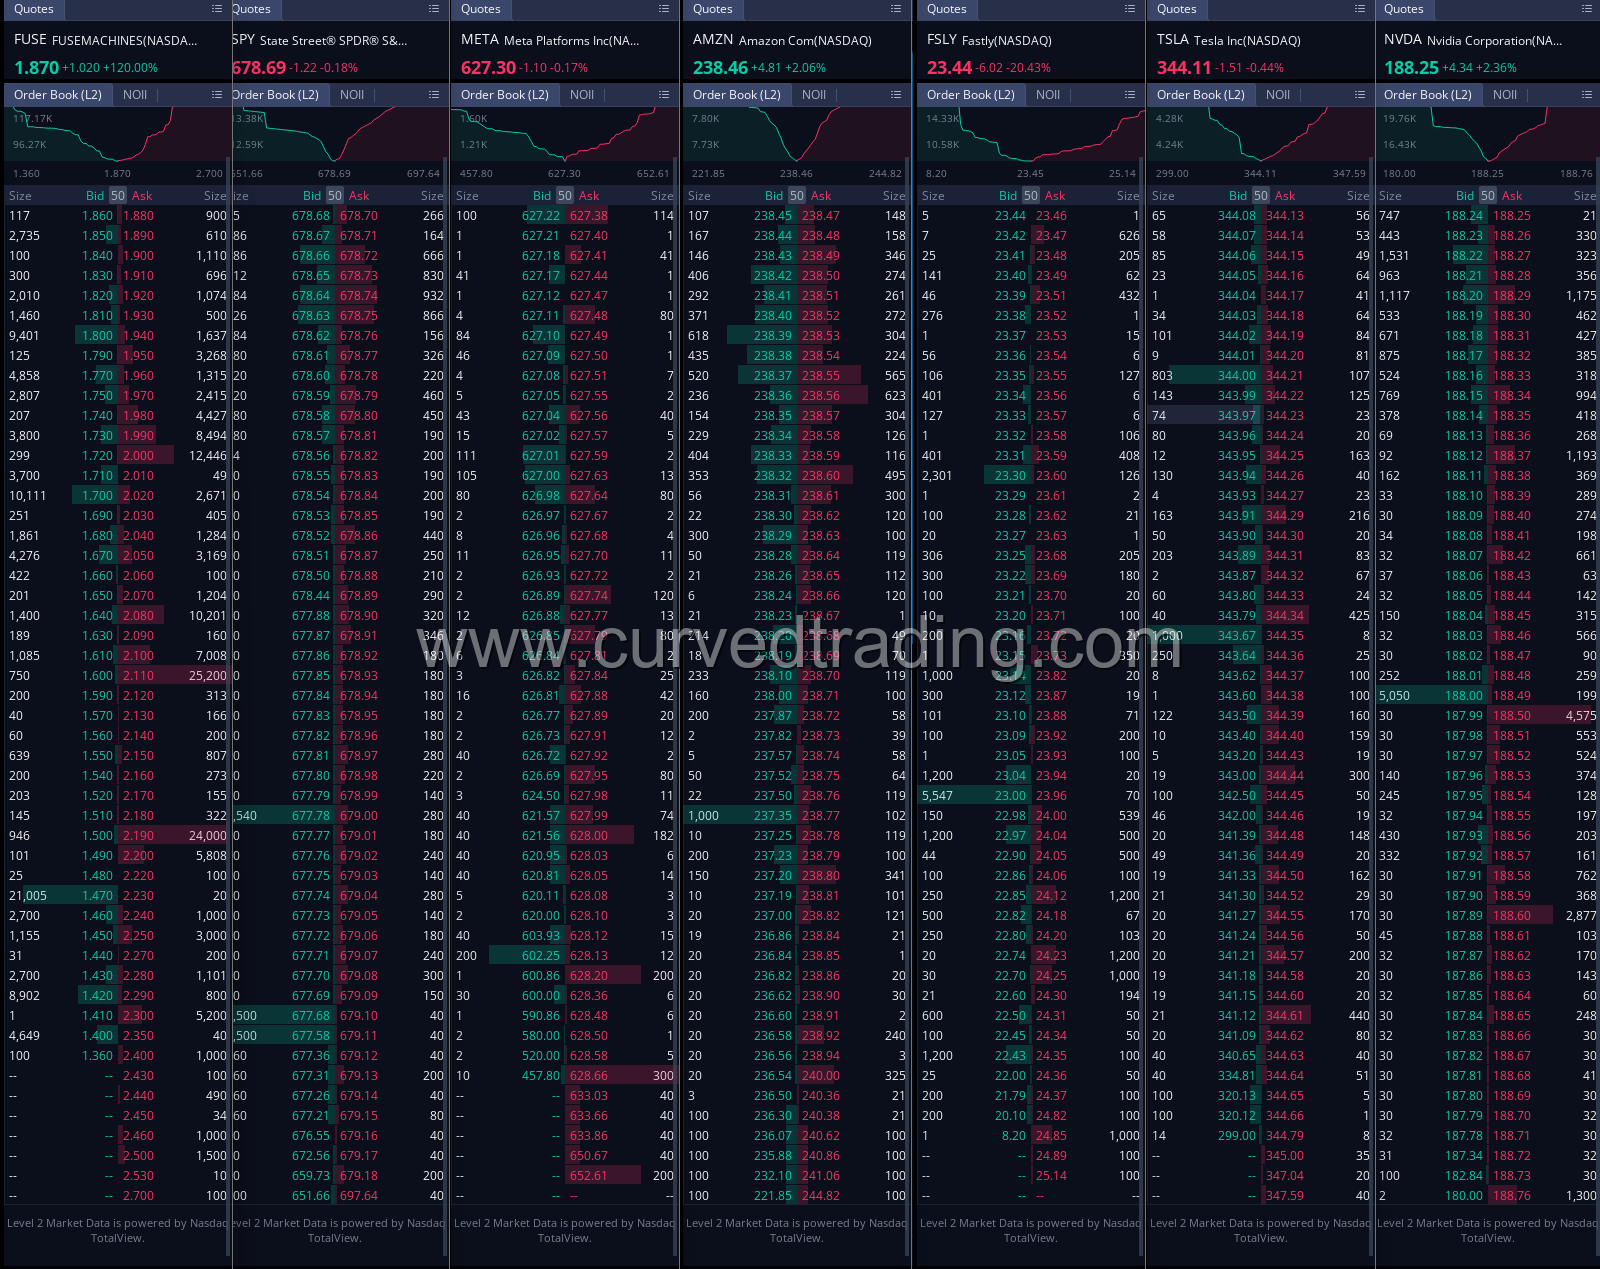
Part 1: How to Read Level 2, Level 1 vs. Level 2 Data Explained
Level 1 data gives you the current best bid, the current best ask, and the last traded price. That is the equivalent of being told the score of a match without being allowed to watch it. You know the result; you understand nothing about how it happened.
Level 2 data, also called the Order Book or Depth of Market (DOM), shows you the full queue of resting limit orders on both sides of the market, organized by price tier. Each row represents a price level with a corresponding size (number of shares or contracts) and, on NASDAQ-listed equities, a Market Maker ID (MMID) that identifies the firm posting that order.
Core Components of a Level 2 Screen
- Bid Price, The highest price at which buyers are willing to purchase. Buyers post these as limit orders and wait.
- Ask Price, The lowest price at which sellers are willing to sell. Sellers post these and wait.
- Size, The number of shares (or lots) posted at each price level. On equities, this is typically displayed in round lots (multiples of 100 shares).
- MMID, The identifier of the market maker or ECN (Electronic Communication Network) posting that quote. Common examples include NSDQ (NASDAQ), ARCA (NYSE Arca), EDGX, BATS, and CITADEL.
The distance between the best bid and best ask is the spread. Everything that follows in this guide builds on these four pillars.
Key takeaway: Level 1 tells you what happened. Level 2 tells you who is positioned and where, before it happens.
Part 2: Reading Market Participant Behavior in the Order Book
The order book is not a neutral ledger. It is a battlefield of competing intentions, and experienced participants routinely use its mechanics to deceive less informed traders.
How to Identify Iceberg Orders (Hidden Orders)
An Iceberg Order is a large institutional order broken into smaller visible tranches to avoid revealing true size to the market. Only a fraction of the order is displayed at any given time; as each tranche is filled, the next is automatically queued.
How to spot them:
- A price level appears to show only 500–1,000 shares on the bid or ask.
- The tape (Time and Sales) prints thousands of shares at that same price level in rapid succession without the level disappearing or the price moving.
- The visible size refreshes repeatedly at the same level as fast as shares are consumed.
Real scenario: During a high-volume session in NVDA (NVIDIA), imagine the ask at $875.00 shows 800 shares via ARCA. The tape prints $875.00 continuously, 2,000 shares, 5,000 shares, 10,000 shares, and yet that ask does not exhaust. The 800-share display keeps refreshing. That is institutional supply absorbing aggressive buying. The iceberg is capping the price.
How to Identify Spoofing in Level 2 Data
Spoofing is the illegal but detectable practice of placing large orders on one side of the book with no intention of executing them, purely to create a false impression of supply or demand, move price, and then cancel before fill.
Characteristics of a spoof:
- A sudden, large size appears on the bid (e.g., 50,000 shares at $874.50 in NVDA) that is dramatically out of proportion with surrounding levels.
- Price moves toward that level as retail traders interpret it as strong support.
- The large order vanishes entirely before price reaches it.
- The spoofer then takes a position on the opposite side at an improved price.
What to watch for:
- Size that appears and disappears within 1–3 seconds without any tape prints at that level.
- Disproportionate size relative to average depth at nearby levels.
- The cancel happens precisely as price approaches, not after.
Spoofing is more common in thinly traded stocks and in futures markets during pre-market hours. In liquid names like SPY or AAPL, the noise-to-signal ratio is higher, but the pattern still appears.
Reading Whale Activity in the Order Flow
Institutional participants, the “whales”, rarely announce their intentions. But they leave footprints.
- Stacked bids at the same price from multiple MMIDs: If you see ARCA, EDGX, and CITADEL all posting size at $875.00, that convergence suggests algorithmic coordination. One firm rarely represents all of them.
- Size that grows progressively: A bid starting at 2,000 shares that refreshes to 3,000, then 4,500 is not random. It is a participant adding conviction.
- Consistent printing on the tape with minimal price movement: When 500,000 shares trade in AMD at $165.00 and the price does not budge, a whale is absorbing. They are not moving the stock because they do not want to yet.
Part 3: Bid-Ask Spread Dynamics, Volatility and Liquidity Signals
The bid-ask spread is not just a transaction cost. It is a real-time barometer of market confidence and liquidity.
What a Tight Spread Tells You
A spread of one penny in TSLA at $175.00/$175.01 signals:
- High liquidity
- Many competing market makers willing to trade
- Lower short-term volatility expectation
- Easier order execution with minimal slippage
What a Widening Spread Tells You
When that same TSLA spread suddenly becomes $175.00/$175.15, something has shifted:
- Market makers are pulling quotes, they perceive elevated risk.
- A news event may be pending or just released.
- Large imbalanced order flow is arriving and the book is adjusting.
- Volatility is spiking.
A widening spread at a key technical level, say, at a prior day high, is a significant signal. It tells you that market makers are unsure, that liquidity is thinning, and that a large directional move may be incoming. The spread widens precisely because the next print is uncertain.
Trade the spread expansion as a warning, not an invitation. Wait for it to re-tighten with a directional bias before committing size.
Part 4: Reading the Heavy Side, Bid vs. Ask Weight
The “heavy side” refers to the dominant weight of resting orders on either the bid or ask. Think of it like a scale, whichever side carries more size, in terms of both depth and consistency, is exerting gravitational pull on price.
Heavy Bid (Bullish Bias)
- Multiple price tiers below the current price show large, stacked bids.
- Refreshing bid size as the tape prints, supply is being absorbed.
- Price keeps returning to the bid rather than exploring the ask.
Implication: Strong near-term support. Buyers are positioned and defending. Price is more likely to grind upward or consolidate before a push higher.
Heavy Ask (Bearish Bias)
- Multiple tiers above current price show large, layered asks.
- Ask levels refresh quickly but bids do not.
- Each attempt to lift the ask fails and prints on the bid.
Implication: Overhead supply is thick. Sellers are in control. Price is gravitationally pulled downward until that ask is exhausted or pulled.
The critical nuance is that size alone is not enough. A heavy bid that does not print (i.e., no tape activity at that level) may be a spoof. A heavy bid that does print, that actually absorbs shares repeatedly without giving ground, is real institutional support.
Part 5: Why Level 2 Is Incomplete Without Time and Sales (The Tape)
This is the most important lesson in this guide.
Level 2 shows you the menu. Time and Sales shows you what is actually being ordered.
The Time and Sales (T&S) feed, also called the tape, records every executed transaction in real time: the price, the size, and whether the transaction was buyer-initiated (uptick, typically green) or seller-initiated (downtick, typically red).
Why the Tape Is Non-Negotiable for Day Trading
Level 2 is a snapshot of resting, unexecuted orders. It updates in near-real-time but can lag during high-velocity moments. The tape is a record of completed transactions, it cannot be faked or cancelled after the fact.
Two critical phenomena only become visible through the tape:
Flushing, Capitulation on the Tape
- A large market sell order hits the bid stack.
- The Level 2 bid side collapses through multiple price levels faster than the display can refresh.
- The tape shows massive red prints, 10,000, 25,000, 50,000 shares, cascading down in price.
- By the time the Level 2 updates, price has already dropped $0.30–$0.50.
Flushing is a capitulation event. In AMZN, a flush through a prior support level on heavy tape volume is a high-probability signal that remaining longs are exiting and a short-term bottom may be forming, particularly if bids begin to rebuild immediately after.
Absorption, Hidden Strength at Resistance
- Price is pressing against a resistance level, say the ask side has 40,000 shares stacked at $185.00 in META.
- The tape shows continuous green prints at $185.00: 500, 1,200, 800, 2,000 shares, buyers are hitting the ask relentlessly.
- The Level 2 shows the ask size barely moving, the 40,000 keeps refreshing.
This is absorption. A large seller is soaking up every buy order.
If absorption eventually breaks, meaning the ask exhausts and the next level up becomes the new ask, that is a breakout signal of exceptional quality. The supply that was holding price down has been consumed.
Part 6: Step-by-Step Drill, Confirming a Breakout Using Level 2 and Time and Sales
Scenario: You are watching QQQ (Nasdaq-100 ETF) approaching its prior week high at $448.50. Volume is building. You want to know whether to trade the breakout or expect a rejection.
Step 1, Establish the Baseline (T-minus 5 minutes)
Observe the average bid and ask size at the levels surrounding $448.50. Note how many MMIDs are represented. Heavy ARCA/NSDQ concentration is typical. Any unusual size from a single source warrants attention. Measure the spread. Is it widening as price approaches resistance? If so, liquidity is thinning, move with caution.
Step 2, Watch the Ask at the Resistance Level
As price touches $448.50, what does the ask show? If you see 100,000+ shares stacked across multiple tiers ($448.50 through $448.75), supply is thick. This is not a clean breakout setup. If the ask levels are thin and spread across many MMIDs in small increments, the resistance may be breakable with moderate buying pressure.
Step 3, Monitor Tape Velocity and Color
Is the tape printing green (buyer-initiated) at $448.50 in increasing size? Count the prints. 10 consecutive green prints of 1,000+ shares is meaningful buying intent. Red prints (seller-initiated) at resistance confirm sellers are winning, do not chase the breakout.
Step 4, Watch for Ask Absorption
The critical tell: ask size at $448.50 begins at 80,000 shares and the tape shows 200,000+ shares printing green at that level without price breaking through. This is absorption by a large seller. The breakout is not happening yet, wait.
When the ask size finally begins to decrease despite continued green tape prints, that seller is running out of supply. This is your pre-breakout signal.
Step 5, Confirm the Breakout
The ask at $448.50 exhausts. The new best ask moves to $448.55, then $448.60. The bid side refreshes aggressively, multiple MMIDs appear at $448.45–$448.50 as the new support. The tape shifts to large, fast green prints in the $448.55–$448.75 range. The spread tightens at the new level.
This is a confirmed breakout. Entry on the first pullback bid, stop below the breakout level.
What Disqualifies the Breakout
- Ask size that does not print despite green tape (suggests the green prints are small and the ask is far from absorbed).
- Spread widens above resistance with no tape follow-through.
- Single large MMID disappears from the bid as price reaches resistance (possible spoof unwinding).
Closing Thoughts: Patience Is the Edge
Ronaldo does not sprint randomly. He holds his position, reads the geometry of the pitch, and moves only when the pattern resolves. The best Level 2 traders operate identically, they watch, catalog, and wait. The tape and the book together tell a story, but that story takes time to write.
The routine described above is not performed in seconds. It unfolds over minutes. Your edge is not being faster than algorithms, it is being more patient and more precise than the reactive retail crowd. You are waiting for institutional intent to become legible before you act.
Level 2 does not predict the future. It reveals the present balance of power at any given price. That is enough, if you know how to read it.
Review the film in the Discord and find your next setup.