The Kickoff: This Is a 4th Quarter Tie Game
Two minutes left. Tied up. The ball is on your own 30-yard line and the entire stadium knows the next drive decides everything.
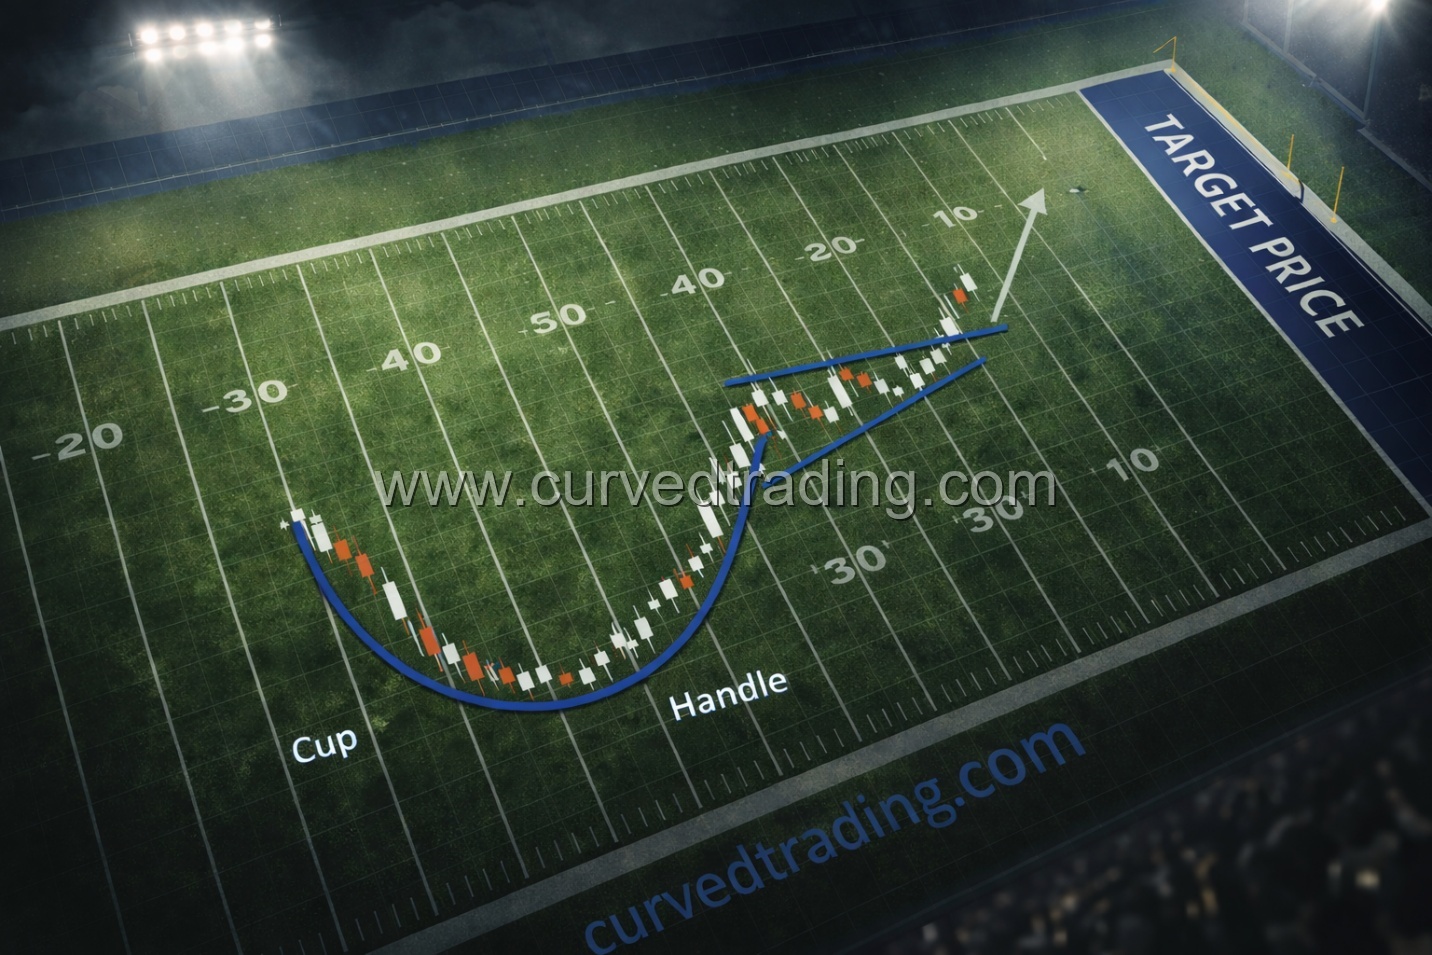
That’s the Cup and Handle.
This isn’t some textbook pattern you highlight with a crayon and hope for the best. The Cup and Handle trading strategy is the structural fingerprint of a market that has been through war, sold off, consolidated, absorbed every share from every weak hand in the building. And is now loaded at the line of scrimmage with one objective: to break through resistance and score.
When you read the tape on a properly formed Cup and Handle, you’re watching institutional accumulation in real time. The supply that hammered price down? Exhausted. The sellers who panicked at the bottom? Gone. What’s left is a demand-side offense that has been quietly stacking positions for weeks, sometimes months, waiting for the play clock to hit zero.
If you can identify this pattern, confirm it with volume analysis, and execute with discipline, you’re running the highest-probability breakout play in the entire playbook of bullish chart patterns.
Let’s break down the film.
The First Quarter: The Left Side of the Cup, The Initial Rally and the Defensive Stand
Every Cup and Handle starts the same way: with a move that got people excited.
Price ran. Momentum was building. The offense was moving the ball downfield with tempo, buyers were in rhythm, bid-side order flow was dominant, and it felt like nothing could stop the drive.
Then the defense made a stand at the Red Zone.
The left side of the cup is that initial rally that stalls out at a key resistance level. Maybe it was a prior swing high. Maybe it was a psychological round number where sell orders were stacked three deep on the Level 2. Doesn’t matter. What matters is that sellers showed up, supply overwhelmed demand, and price began to correct.
This correction is critical, and it’s where amateurs panic.
They see the pullback and think the drive is dead. They dump shares at the worst possible time. They’re the fans heading for the parking lot in the third quarter. But a veteran trader? A veteran trader sees a correction off a rally and asks one question: How is this selling happening?
If the sell-off is violent, gap-down, high-volume capitulation, that’s a blown play. Reset. But if the correction is gradual, orderly, and volume is declining as price drifts lower? That’s the defense bending, not breaking. That’s a setup, not a breakdown.
The left side of the cup establishes the prior high, your resistance level, your line of scrimmage for the eventual breakout. Mark it. Burn it into your chart. Every decision you make from here revolves around that level.
Halftime Adjustments: The Bottom of the Cup, The Quiet Huddle
Here’s where the game is actually won.
The bottom of the cup is a U-shaped consolidation, not a V, not a sharp reversal. A slow, grinding, rounded base where price action goes dead quiet. To the untrained eye, it looks like nothing is happening. The stock looks “boring.” Volume dries up. Financial media stops talking about it.
That’s exactly the point.
This is the team in the locker room at halftime. The coach is making adjustments. The game plan is being refined. And most importantly, the weak hands are leaving the stadium.
Here’s the technical reality of what’s happening at the bottom of the cup: supply is being permanently removed from the market. Every retail trader who bought the rally and rode it down has now either sold at a loss or is sitting on dead money with zero conviction. They’re done. They’re not a factor anymore.
Meanwhile, and this is what separates tape readers from chart watchers, institutional buyers are quietly accumulating. You’ll see it on the time and sales if you know what to look for: blocks of shares being absorbed at the bid without pushing price down. Dark pool prints showing up after hours. The kind of silent, methodical buying that doesn’t make headlines but reshapes the entire supply-demand equation.
Low volume at the bottom of the cup isn’t a warning sign. It’s confirmation. It tells you that sellers are exhausted and buyers are patient. The huddle is focused. The adjustments are made.
The bottom needs to be rounded, not sharp. A V-bottom means the stock bounced on a catalyst or a short squeeze, it’s reactive, not structural. A U-bottom means time has passed, hands have changed, and the stock’s entire ownership structure has shifted from weak to strong. That takes weeks. Sometimes months. Let it cook.
The 4th Quarter Surge: The Right Side of the Cup, The Crowd Gets Loud
Now it gets exciting.
Price begins to climb off the bottom and work its way back up toward that prior high, the resistance level established by the left side of the cup. This is the offense driving downfield in the 4th quarter, and the Home Crowd is starting to feel it.
That crowd? That’s volume. And volume is the single most important confirmation tool in the entire Cup and Handle trading strategy.
Volume Is Crowd Noise
As price moves up the right side of the cup, you need to see volume increasing. Not flat. Not declining. Increasing. Each successive push higher should come on heavier volume than the last. The crowd noise is getting louder. The stadium is filling back up, but this time, it’s not the retail tourists who left at halftime. It’s the institutional heavyweights, the funds, the smart money that’s been accumulating at the bottom and is now adding on strength.
Watch the order flow on the Level 2 as price approaches resistance. You want to see bids stacking, large blocks appearing on the bid side, absorbing any sell pressure. You want to see the ask thinning out, sellers pulling their orders because they sense what’s coming. The tape should be speeding up. Prints should be hitting the ask, not the bid.
The False Start Penalty
Here’s the trap: if price approaches the prior high on quiet volume, declining or flat, that’s a False Start penalty. Five yards back. The play doesn’t count.
A low-volume approach to resistance means there isn’t enough demand-side conviction to absorb the supply waiting at that level. Every trader who bought on the left side and rode it all the way down and back up is sitting at breakeven, desperate to sell and “get their money back.” That’s a wall of supply. You need heavy volume, a roaring crowd, to blast through it.
Quiet volume at resistance = failed breakout. Full stop. Do not pass go. Do not enter the position.
The Two-Minute Warning: The Handle, The Stadium Holds Its Breath
Price has rallied back to the prior high. Volume has been building. The offense is at the opponent’s 10-yard line.
Then comes the handle.
The handle is a brief, shallow pullback, typically 5–10% from the cup’s high, on drastically reduced volume. This is the two-minute warning. It’s the strategic timeout before the biggest play of the game. The entire stadium is holding its breath.
What’s happening technically? The last remaining sellers, the ones who bought near the top, rode the entire cup down and back up, and are now at breakeven, are selling. They’re taking their “get out of jail free” card. And the market is absorbing every single share they throw out without price collapsing. That’s the tell.
The handle should be:
Short in duration, one to four weeks maximum. Any longer and it’s not a handle, it’s a new consolidation. The play clock is running.
Shallow in depth, a retracement of 10–15% at most from the cup’s rim. Deeper than that and the pattern’s structural integrity breaks down.
Low in volume, this is non-negotiable. Volume during the handle must be significantly lower than the volume on the right side of the cup’s rally. The crowd is silent. Anticipation is maximal.
Think of the handle as a final shakeout. The last weak hands. The last nervous holders. The last defenders making one more stand before the goal line. Once they’re gone, there’s nobody left to sell.
And when nobody’s left to sell, price can only do one thing.
The Touchdown: The Breakout, The Stadium Erupts
The snap. The throw. The catch in the end zone. Pandemonium.
The breakout above the handle’s high, confirmed by a massive volume spike, is the touchdown. This is the moment the Cup and Handle trading strategy pays off. Price clears resistance, supply is nonexistent, and demand floods in from every direction.
Here’s what you’re looking for on the tape:
Tape Speed accelerates dramatically. Time and sales turns into a blur of green prints hammering the ask. Orders are lifting offers, not waiting for fills at the bid. This is urgency. This is stock market momentum in its purest form.
Market Maker behavior shifts. The spread tightens because Market Makers are no longer willing to hold short inventory against a tide of buying pressure. They step aside. They move their asks higher in rapid succession. When you see the ask laddering up with minimal resistance on the Level 2, you’re watching the defense collapse in real time.
The volume spike on the breakout candle should be the highest-volume session in the entire pattern. Higher than anything on the left side, the bottom, or the right side. This is the stadium erupting. This is institutional capital committing. This is the confirmation that the breakout is real, not a head-fake.
A breakout without volume is an incomplete pass. Do not chase it. Wait for the volume or walk away.
Film Study: Why Most Cup and Handles Don’t Look Like the Textbook
Here’s what nobody tells you in the intro course: most Cup and Handle patterns in the wild are ugly. They’re not the clean, symmetrical diagrams you see in a trading textbook. The left side might be steeper than the right. The bottom might have a couple of choppy spikes instead of a smooth curve. The handle might form twice before the breakout finally triggers. Welcome to real markets.
The key is understanding what the pattern represents, not memorizing what it’s supposed to look like in a PowerPoint slide. As long as the supply-demand dynamics are intact, exhausted sellers, accumulating institutions, rising volume on the right side, low-volume handle, the pattern is valid even if it’s not Instagram-pretty.
Think of it this way: no two game-winning drives look the same. Some are methodical, 12-play marches. Others feature a scramble, a broken play, a third-and-long conversion that had no business working. The drive doesn’t have to be pretty. It has to score.
Timeframe Matters: Weekly and Monthly Charts Are the Starting Lineup
This is where experience separates the veterans from the rookies. A Cup and Handle on a 10-minute or 1-hour chart is the practice squad. It might work. It might not. The pattern hasn’t had time to develop the kind of deep, structural hand-change that gives the breakout real power. The “cup” on a 10-minute chart might represent 90 minutes of price action, that’s not institutional accumulation, that’s a coffee break.
Now compare that to a Cup and Handle on a weekly or monthly chart. That pattern has been building for months, sometimes over a year. The consolidation at the bottom represents weeks of quiet accumulation. The volume signatures are backed by real institutional flow, fund managers rotating capital, not day traders flipping 200 shares. The weak hands haven’t just left the stadium; they’ve left the city.
Weekly Cup and Handles are the bread and butter for swing traders and position traders. The breakout tends to produce multi-week runs with follow-through because the supply overhead has been genuinely absorbed over time. When a weekly Cup and Handle breaks out on volume, you’re riding with the institutions, not against them.
Monthly Cup and Handles are the franchise quarterbacks of chart patterns. These are rare, but when they fire, they produce the kind of moves that define entire years. Think of a stock that spent 18 months building a base, silently changing ownership from retail to institutional hands, and then breaking out on a volume surge that shows up on the monthly candle like a skyscraper. That’s a move you ride for quarters, not days.
The rule of thumb: the bigger the timeframe, the more reliable the pattern. A Cup and Handle on the daily chart is solid. On the weekly, it’s strong. On the monthly, it’s an elite setup. On the 10-minute chart? That’s a scrimmage, not a playoff game. Trade it if you want, but size down and keep expectations in check.
Always start your analysis on the higher timeframes and work down. If a weekly Cup and Handle is forming, then zoom into the daily to fine-tune your entry. If nothing is happening on the weekly, a Cup and Handle on the 15-minute chart isn’t going to carry the same conviction. Read the big picture first. The game plan starts with the season, not the snap count.
The Science of the Play: Technical Execution
The pattern is beautiful, but beauty doesn’t pay the bills. Execution does. Here’s how you run this play with precision.
The Line of Scrimmage: Stop Loss Placement
Your stop loss is your line of scrimmage, lose it and the play is dead. There are two schools of thought here, and both have merit:
Conservative stop: Below the bottom of the handle. This gives the trade room to breathe but increases your risk per share. For swing trades on daily charts, this is typically the play.
Aggressive stop: Below the breakout candle’s low. Tighter risk, but you’ll get stopped out more often on normal volatility. Better for intraday breakouts on the 15-minute or 60-minute chart where you need precision.
Either way, define your stop before you enter. Calculate your position size based on the distance between your entry and your stop. This is where your Risk Management system earns its keep. No stop = no trade. Period.
The End Zone: Calculating the Target Price (Measured Move)
The textbook measured move target for a Cup and Handle breakout is calculated by taking the depth of the cup, from the left-side high to the absolute bottom, and adding that distance to the breakout point.
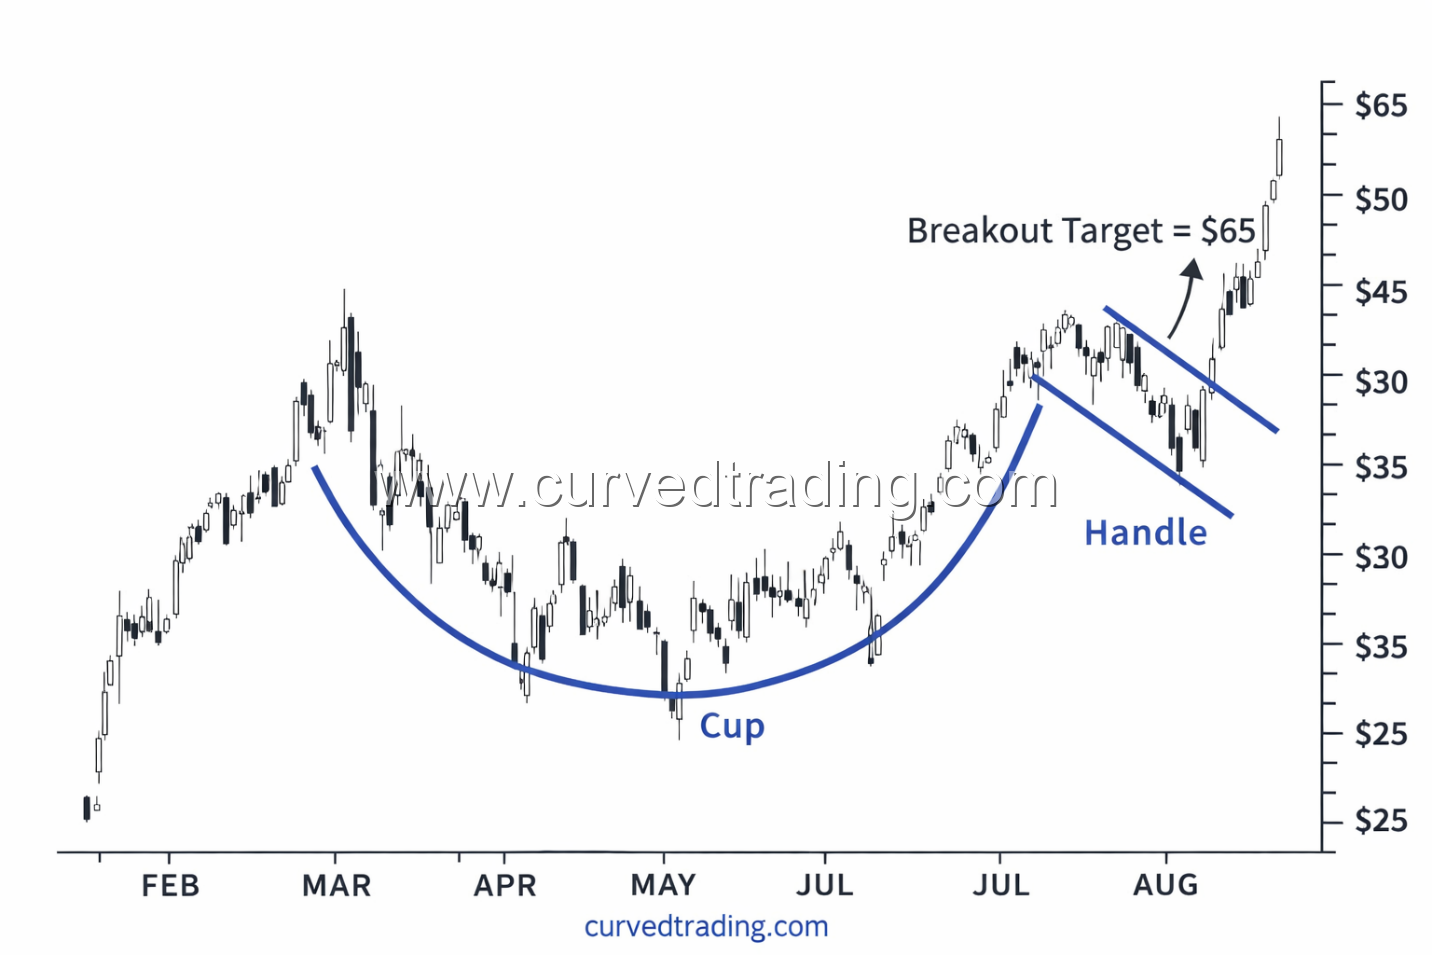
Example: If the cup’s rim is at $50 and the bottom of the cup is at $35, the depth is $15. Your measured move target on the breakout is $50 + $15 = $65.
That’s your End Zone. That’s where you plan to spike the ball.
But here’s the veteran move: scale out. Take a third off at the first significant resistance level. Take another third at the measured move target. Let the final third ride with a trailing stop. You don’t score a touchdown and immediately punt. You play to maximize the drive.
Level 2 Signals: Confirming the Touchdown Through Order Flow
Before you pull the trigger on the breakout entry, scan the Level 2 for these confirmation signals:
Bid stacking at the breakout level. Large institutional-sized orders (1,000+ shares on mid-caps, 10,000+ on large-caps) sitting on the bid directly below the breakout price. These are the blockers clearing the lane.
Ask thinning above resistance. If the sell orders above the breakout level are small and scattered, 100-lot retail orders with no conviction, the path is clear.
Dark pool prints. Watch for large block trades printing on the tape at or above the breakout level. These won’t show on the Level 2 but they confirm institutional participation.
No large hidden sellers. If price breaks out but immediately gets slammed back below by a hidden iceberg order on the ask, step aside. That’s a linebacker you didn’t account for. Let the market prove the breakout is real before committing capital.
When the Level 2 confirms, the volume confirms, and the price confirms, you execute. Decisively. No hesitation. The play is live.
A Note on Short Selling
Every scored touchdown has a losing side. If the Cup and Handle fails, price breaks below the handle’s low on heavy volume, the pattern is invalidated and the opposite trade is in play. The same traders who were accumulating may now be liquidating, and the momentum reversal can be swift and brutal. Know where the pattern fails so you can flip the script if the defense wins.
The Post-Game Press Conference
The Cup and Handle trading strategy isn’t a pattern, it’s a narrative. It tells the story of a stock that rallied, corrected, consolidated, changed hands from weak to strong, and then broke out with conviction. Every phase has a purpose. Every volume signal has meaning. Every pullback is a setup, not a setback.
When you see this pattern forming on the daily chart of a stock with strong fundamentals and institutional sponsorship, you’re looking at the highest-probability breakout setup in all of technical analysis. The bullish chart pattern that has launched more sustained runs than any other formation in the playbook.
But the play only works if you execute it with discipline. Define your risk. Confirm with volume. Read the tape. And when the breakout fires, trust the preparation and pull the trigger.
Now go review the Game Tape. Break down every Cup and Handle on your watchlist. Chart them. Study the volume signatures. Identify where the weak hands left and where the institutions stepped in. The film room is where championships are won.
Let’s get to work.