The Tip-Off: What Is the Double Bottom?
Picture this. Fourth quarter. The opposing point guard has been attacking the paint all game. He’s blown past screens, split defenders, and scored at the rim almost at will. Your team is down, the momentum is against you, and the crowd is quiet.
Then something changes.
He drives again, same move, same angle, and your center meets him at the rim with a clean, emphatic block. The ball ricochets off his hands. The crowd stirs. He gets the ball back, resets at the perimeter, and drives again. Same spot. Same intent. And your center is waiting there again. Denied. The stadium erupts. Your point guard scoops the loose ball and pushes a fast break the other way for an easy bucket.
That’s the Double Bottom bullish reversal pattern.
The sellers are the offense, driving price down toward a key support level, trying to score a breakdown. The buyers are the defense, protecting the rim, refusing to let price fall any further. When the sellers get stuffed at the same level twice, they’re gassed. Out of ideas. And the buyers transition from defense to offense in a heartbeat.
On the chart, it prints as a “W”, two lows at roughly the same price, separated by a relief rally, followed by a breakout above the peak between them. It’s one of the most reliable bullish reversal setups in all of technical analysis, and if you understand the psychology behind it, you’ll never look at a “W” the same way again.
The Psychology of the “W”: Why Do Sellers Give Up at the Second Test?
This is the question that separates chart readers from tape readers. Anyone can spot a “W” on a chart after the fact. The edge comes from understanding why it works.
The First Drive: Conviction
The first bottom is the sellers’ best shot. They’ve had momentum. Price has been trending down. Bears are confident, shorts are piling in, and every rally gets sold. When price reaches a key support level, the rim, sellers are driving with full conviction. They expect to break through.
But the defense holds. Buyers step in at that level with size. Institutional bids absorb the selling. The drive gets blocked. Price bounces.
At this point, nothing is confirmed. A single bounce off support happens all the time. The sellers aren’t discouraged yet. They’re regrouping at the perimeter.
The Kick-Out: The Relief Rally
Price rallies off the first bottom, creating what’s called the neckline, the peak between the two lows. This is the kick-out pass. The point guard got denied, passed the ball back out to the three-point line, and the team is resetting the offense.
This rally is typically weak. Volume is modest. It’s not a momentum shift, it’s a pause. Sellers are still in control of the game plan. They’re just catching their breath before the next drive.
The neckline level is critical. Mark it. That’s your breakout line. That’s the half-court marker where defense turns into offense.
The Second Drive: Exhaustion
Here’s where the psychology gets interesting. The sellers drive again. Same level. Same support zone. They’re going back to the rim with everything they’ve got.
And the defense is waiting.
The second test of support is where you watch the volume closely. If the second bottom forms on lower volume than the first, that’s the tell. The sellers are running out of gas. Their best player is tired. The drives are less aggressive. The selling pressure is weaker even though price is reaching the same level.
The defense doesn’t just hold, it holds easier than the first time. That’s the shift. That’s the moment the crowd realizes the other team can’t score anymore. The sellers threw their best punch twice and couldn’t break through. Their conviction is shattered.
When conviction breaks, positions get covered. Shorts start buying back. And that buying, combined with the fresh demand from buyers who watched the defense hold twice, creates the fuel for the fast break.
The Basketball Play-by-Play: Anatomy of the Pattern
First Bottom, The Drive to the Hoop
Price drops to a key support level on strong volume. This is the initial sell-off, the offense attacking with tempo. Buyers absorb the pressure, and price bounces. On the chart, this is the left side of the “W.”
What to look for: high volume at the first bottom. Sellers are committed. This is a real test of support, not a casual dip. The stronger the selling and the firmer the defense, the more meaningful the eventual reversal.
The Peak, The Kick-Out to the Perimeter
Price rallies to create the neckline. This bounce is the ball getting kicked back out after the blocked shot. The rally typically retraces 10–20% of the prior decline.
What to look for: moderate volume on the rally. This shouldn’t be explosive, if it is, you might be looking at a V-bottom reversal instead of a double bottom. The neckline rally should feel like a breather, not a breakout.
Second Bottom, The Block at the Rim
Price drops back to the same support zone, or very close to it. This is the second drive. The sellers are trying the same play again.
What to look for: lower volume than the first bottom. This is the most important signal in the entire pattern. Lower volume on the second test means the sellers are losing conviction. The defense is holding with less effort. The block is coming.
The second bottom doesn’t have to be at the exact same price as the first. Within 1–3% is typical. If the second bottom is slightly higher than the first, that’s even more bullish, the defense is pushing the line forward. If it’s significantly lower, the pattern may be failing. The rim has been lowered.
Confirmation Signals: The Fast Break Breakout
The double bottom is not confirmed until price breaks above the neckline. Everything before that is just the defense holding. The fast break, the transition from defense to offense, happens when price clears that peak between the two bottoms.
Volume Is the Crowd Erupting
The breakout above the neckline must come on a surge of volume. This is the fast break in full flight, your point guard pushing the ball up the court with the entire arena on its feet. If the breakout happens on quiet volume, it’s a turnover waiting to happen. The transition isn’t real.
Here’s what you want to see on the tape: prints hammering the ask, the bid stacking up below the neckline as it flips from resistance to support, and the spread tightening as market makers adjust to the new demand. The order flow should feel urgent. Buyers aren’t waiting for dips anymore. They’re chasing the break.
The Retest: Coming Back to Half-Court
After the initial breakout, price will often pull back to retest the neckline from above. This is the equivalent of the other team calling a timeout to stop your momentum. It’s normal. It’s healthy.
The key: the neckline must hold as new support on the retest. If price drops back below the neckline on heavy volume, the fast break has been stopped and the pattern has failed. But if the neckline holds, if the defense-turned-offense protects that level, it’s a second-chance entry and often the highest-probability trade in the entire setup.
The Game Plan: Entry, Stop Loss, and Price Targets
Entry, The Neckline Break
Your primary entry is on the breakout above the neckline, confirmed by a volume spike. Aggressive traders enter on the breakout candle itself. Conservative traders wait for the retest of the neckline as support.
Both approaches have merit. The aggressive entry gets you in early but risks a false breakout. The conservative entry has better confirmation but risks missing the move entirely if there’s no retest. Pick the one that matches your risk tolerance and stick with it.
Stop Loss, Below the Rim
Your stop goes below the second bottom. That’s the rim. If price breaks back below the level that the defense held twice, the pattern is invalidated. The sellers finally scored. Get out.
For tighter risk management, place the stop just below the lowest point of the two bottoms. If the second bottom was slightly higher than the first, use the first (lower) bottom as your reference. Give it a small buffer, a few cents on stocks, a few ticks on futures, to account for normal noise.
This is where your Risk Management discipline earns its paycheck. Calculate your position size based on the distance from entry to stop. No exceptions. No “I’ll add more if it dips.” The play is defined before the ball is inbounded.
Price Target, The Fast Break Layup
The measured move target for a double bottom is calculated by taking the distance from the bottoms to the neckline and projecting that same distance above the neckline.
Example: If both bottoms form at $40 and the neckline is at $46, the depth is $6. Your target is $46 + $6 = $52.
That’s your fast break layup, the easy bucket after the transition. But just like in basketball, you don’t always have to settle for the layup. If momentum is strong, volume is sustaining, and the stock is clearing resistance levels above the target, let it run. Trail your stop and ride the break.
Scale out in thirds: first third at the measured move target, second third at the next resistance level, final third on a trailing stop. Don’t score one bucket and call a timeout. Keep the pressure on.
Scouting Report: Real Double Bottoms vs. Fake-Outs
Not every “W” on a chart is a double bottom. Some are traps. Here’s how to scout the difference.
The Dead Cat Bounce
A stock in freefall bounces off a level, drifts back down, bounces again weakly, and then collapses through support entirely. This looks like a double bottom in formation, until it doesn’t. The tell: volume doesn’t decline on the second bottom. If selling pressure is just as heavy or heavier on the second test, the defense isn’t holding. The rim is about to break. Walk away.
The False Breakout
Price clears the neckline on thin volume, traps a bunch of breakout buyers, then reverses hard back below. This is the equivalent of a fast break that ends with a charge call. The transition wasn’t real, it was manufactured by a few eager buyers without institutional backing.
The defense against this: demand volume confirmation. No volume surge on the neckline break = no entry. Period. If the crowd isn’t on its feet, the fast break isn’t real.
The Time Factor
Legitimate double bottoms need time to develop. The two bottoms should be separated by at least a few weeks on a daily chart, ideally 4–8 weeks. If the two bottoms form within a few days, you’re likely looking at normal volatility, not a structural reversal. The defense needs time to set up. A snap block is lucky. A game plan that denies the same drive twice is elite.
Timeframe Reliability
Just like every pattern in technical analysis, higher timeframes produce more reliable signals. A double bottom on a weekly chart carries far more weight than one on a 15-minute chart. The weekly version represents weeks of institutional buying defending a level. The 15-minute version represents a slow lunch hour. Trade both if you want, but size accordingly. The weekly setup is the starter. The intraday setup is the bench player.
The Post-Game: Transition Complete
The Double Bottom bullish reversal is the chart’s way of telling you that the selling game is over. The defense held the rim. Twice. The offense is out of plays. And the momentum has shifted from sellers to buyers in a way that can fuel rallies lasting weeks or months.
But the pattern only works if you respect the process. Wait for the second bottom on declining volume. Wait for the neckline break on surging volume. Place your stop below the rim. Calculate your target. And when the fast break is live, when the order flow confirms, the volume confirms, and the neckline is cleared, you run with it.
No hesitation. No second-guessing. The defense did its job. Now it’s your turn to score.
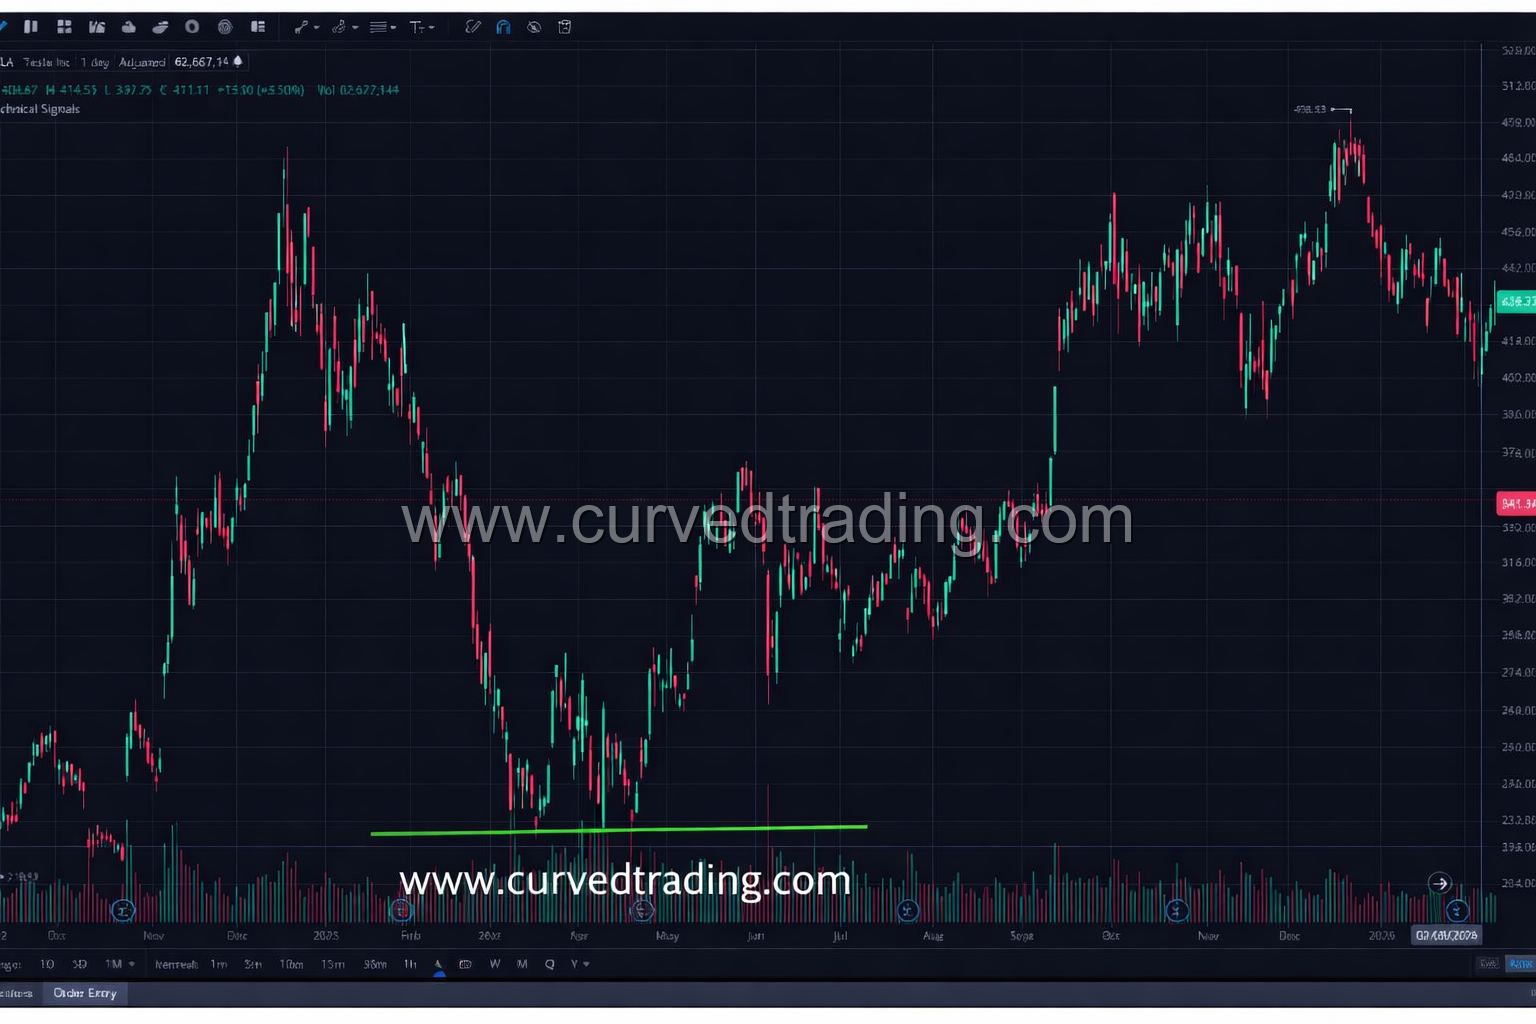
I played the Tesla double bottom in $220s and rode out the wave all the way to $350s.
The film room is open. Go find your next “W.”