
What Are Bollinger Bands?
In boxing, a great fighter does not just watch their opponent’s fists. They read the range, how far the opponent can reach, how wide their stance is, where the danger zone begins and ends. The moment that range compresses, the knockout punch is coming.
Bollinger Bands are the trading equivalent of that range. Developed by John Bollinger in the early 1980s and introduced formally in his 2001 book Bollinger on Bollinger Bands, they are a volatility indicator that wraps a dynamic envelope around price, expanding when markets are volatile, contracting when they are calm. The moment that envelope compresses to an extreme, a major move is loading.
At their core, Bollinger Bands consist of three lines plotted on a price chart:
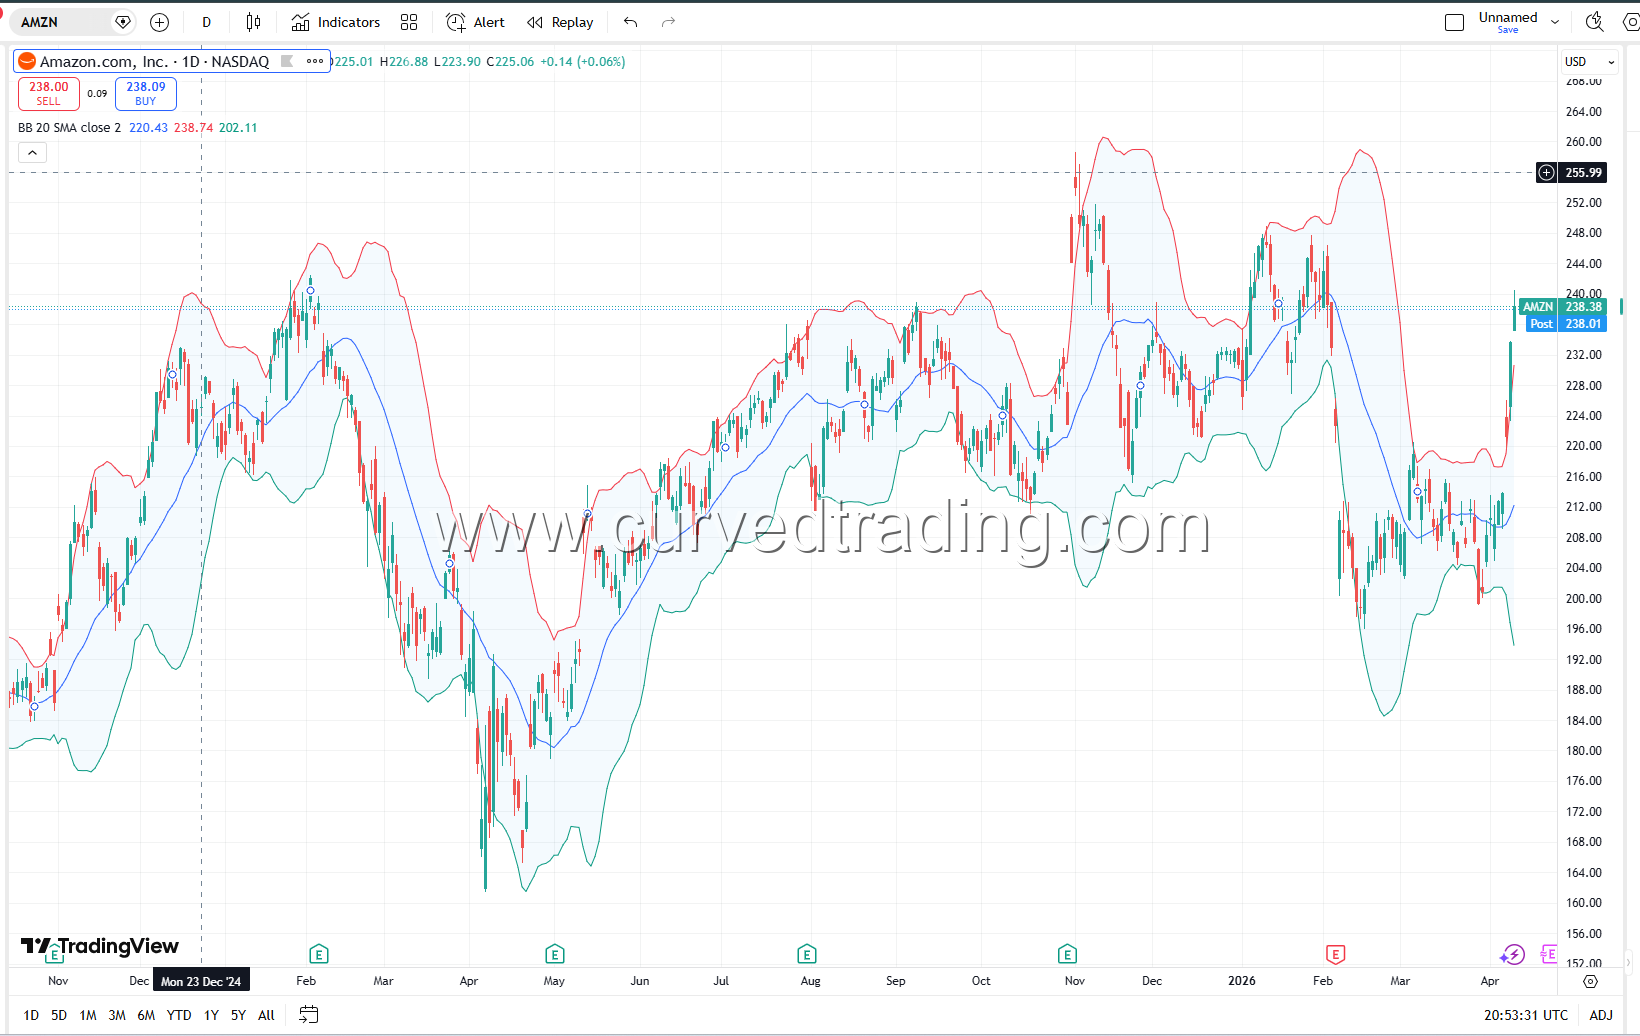
- The Middle Band, a 20-period simple moving average (SMA) of closing prices
- The Upper Band, the middle band plus two standard deviations
- The Lower Band, the middle band minus two standard deviations
That’s the structure. Everything else, the strategies, the signals, the edge, flows from understanding what those three lines actually mean.
The Math Behind Bollinger Bands
Understanding the formula is not optional. It tells you exactly what the bands are measuring and why they behave the way they do.
Step 1, Calculate the Middle Band
Middle Band = 20-period Simple Moving Average (SMA) of closing price
Sum the last 20 closing prices and divide by 20. This is your baseline, the average price over the last 20 bars.
Step 2, Calculate the Standard Deviation
Standard deviation measures how spread out the closing prices are relative to the 20-period average. A high standard deviation means prices have been moving wildly. A low standard deviation means prices have been moving in a tight, compressed range.
Standard Deviation (σ) = √ [ Σ(Close − SMA)² ÷ 20 ]
In plain English: for each of the 20 periods, subtract the SMA from the closing price, square the result, sum all 20 squared values, divide by 20, and take the square root.
Step 3, Plot the Upper and Lower Bands
Upper Band = SMA + (2 × Standard Deviation) Lower Band = SMA − (2 × Standard Deviation)
Why two standard deviations? In a normal distribution, approximately 95% of all data falls within two standard deviations of the mean. Applied to prices, this means that statistically, about 95% of all closing prices should fall inside the bands. When price touches or breaches the upper or lower band, it is in statistically rare territory, which is precisely what makes the signal meaningful.
The Three Core Bollinger Band Signals
Signal 1, The Bollinger Band Squeeze
The squeeze is the most powerful setup Bollinger Bands produce and the one John Bollinger himself considers most significant.
A squeeze occurs when the upper and lower bands contract toward each other to an extreme degree, when volatility compresses to a multi-month low. Markets alternate between periods of low volatility and high volatility. An extreme compression almost always precedes an explosive expansion.
How to identify a squeeze:
- The bands are closer together than they have been in the past 6 months
- The middle band (20 SMA) is flat, price is coiling, not trending
- Volume is declining as price consolidates
What to do: Wait. A squeeze tells you that a big move is coming, not which direction. Use other signals, RSI momentum, price action, sector news, to determine the likely direction before entering.
Real example: Imagine AMZN consolidating between $178 and $182 for three weeks. The Bollinger Bands tighten to their narrowest point in four months. Then a catalyst hits, strong earnings. Price gaps to $190, the bands explode outward, and the upper band acts as a runway, not a ceiling. That gap was telegraphed by the squeeze.
Signal 2, Band Riding (Trending Markets)
Here is the most common Bollinger Band mistake beginners make: they treat the upper band as a sell signal and the lower band as a buy signal in every market condition. That is wrong.
In a strong trend, price can and does “ride the band”, hugging the upper band in an uptrend or the lower band in a downtrend for extended periods without reverting to the mean.
Signs that price is riding the band legitimately:
- The middle band (20 SMA) is sloping strongly in the direction of the trend
- Price closes repeatedly at or near the outer band, not just touching and rejecting
- Volume is elevated and consistent
What this means for trading: In a trending stock, touching the upper band is not a short signal. It is a sign of strength. The trade is to buy pullbacks to the middle band (20 SMA), not to fade the strength.
Think of NVDA during its 2023–2024 run. RSI stayed above 70, price rode the upper Bollinger Band for weeks at a time. Every trader who shorted the upper band got squeezed. The correct play was buying the 20 SMA on every pullback.
Signal 3, Mean Reversion (Range-Bound Markets)
When the middle band is flat and the bands are of consistent, moderate width, not squeezing, not exploding, price tends to oscillate between the upper and lower bands in a mean reversion pattern.
In this environment, the rules are the opposite of trend-following:
- Price touching the upper band → potential short or fade setup
- Price touching the lower band → potential long or bounce setup
- Target: the middle band (20 SMA) on both sides
The key distinction: You can only use mean reversion signals when the trend is flat. If the 20 SMA is sloping, you are in a trending environment and mean reversion fades will get you killed.
A simple filter: if the 20 SMA has moved less than 0.5% over the last 10 bars, the market is range-bound. If it has moved more, you are trending.
Bollinger Bands Settings, When to Adjust
The default settings (20-period SMA, 2 standard deviations) work well for most applications, but context matters.
| Timeframe | Period | Std Dev | Best For |
|---|---|---|---|
| 1–5 min | 10–14 | 2.0 | Scalping, fast reversals |
| 15 min–1 hour | 20 | 2.0 | Day trading standard |
| Daily | 20 | 2.0 | Swing trading standard |
| Weekly | 20 | 2.1 | Position trading |
John Bollinger’s own guidance: if you shorten the period, tighten the standard deviation multiplier (e.g., 10 periods, 1.5 SD). If you lengthen it, widen it (e.g., 50 periods, 2.5 SD). The goal is always to keep approximately 90–95% of price action inside the bands.
Bollinger Bands vs. Keltner Channels
Both are volatility envelope indicators. Here is the critical difference:
Bollinger Bands use standard deviation, they respond to raw price volatility. When a stock has a big single-day move, the bands expand immediately.
Keltner Channels use Average True Range (ATR), they respond to a smoothed measure of volatility, making them less reactive to single-candle spikes.
The most popular advanced setup combines both: the Bollinger Band Squeeze with Keltner Channels. When the Bollinger Bands are inside the Keltner Channels, volatility is at an extreme low and a major move is imminent. This is the precise, quantified version of the squeeze signal.
A Complete Day Trading Setup with Bollinger Bands
Scenario: You are watching SPY on a 15-minute chart in the first hour of trading.
Setup, Squeeze into breakout:
- SPY consolidates between $520 and $522 for the first 45 minutes. Bollinger Bands tighten to their narrowest level of the morning session.
- RSI is hovering at 48–52, neutral momentum, no directional bias yet.
- At 10:15 AM, SPY breaks above $522 on a surge in volume. The upper band begins expanding upward.
- RSI crosses above 55, momentum confirming the direction.
- You enter long at $522.25, stop below the middle band at $521.00.
- Target: upper band projection of $524.50. Risk/reward: approximately 1:1.8.
What made this valid:
- Volatility compression (squeeze) preceded the move
- Volume confirmed the breakout
- RSI provided directional confirmation
- Entry was at the breakout candle, not chasing
Three Mistakes Traders Make with Bollinger Bands
Mistake 1, Treating every band touch as a reversal signal. Band touches are only reversal signals in range-bound markets with a flat 20 SMA. In trending markets, they mean nothing.
Mistake 2, Ignoring the width of the bands. The distance between the bands is as important as where price is within them. Wide bands = high volatility = choppier signals. Narrow bands = low volatility = squeeze loading.
Mistake 3, Using Bollinger Bands alone. They are a volatility tool, not a directional tool. Combine with RSI for momentum, volume for confirmation, and price structure (support/resistance) for entry precision.
Why Bollinger Bands Have Survived 40 Years
Most indicators come and go. Bollinger Bands, introduced in the early 1980s, are still standard on every trading platform in the world, ThinkorSwim, Webull, TradingView, Interactive Brokers, all of them. The reason is elegant simplicity: they are built on two of the most fundamental concepts in statistics (moving average and standard deviation), applied to price in a way that is instantly readable.
They do not predict direction. They map the territory of price, where it has been living, how compressed that territory is, and when that compression is about to break. That is not a small thing. In a market full of traders chasing lagging indicators and overfit signals, knowing when volatility is about to explode, before it does, is one of the cleanest edges available to a retail trader.
Learn the squeeze. Respect the trend. Use the bands as context, not commands.
That is how Bollinger Bands become a weapon.