
You Are Not Reading Price, You Are Reading Noise
Open any stock chart without indicators. What you see is a jagged, unpredictable line, price spiking up, pulling back, reversing, faking out. It looks random because, in the short term, it mostly is. Minute-to-minute price reflects thousands of individual decisions, panic sells, algorithmic pings, and emotional reactions stacked on top of each other.
A moving average strips all of that away.
It answers one question that no individual candle can: What has price actually been doing? Not this second, not in this single bar. But on average, across a meaningful window of time. And once you see the average direction clearly, trading becomes less like guessing and more like navigating with a map.
This guide will teach you what a moving average is, how the different types work, and, most importantly, how to actually use one in a trade.
What Is a Moving Average?
A moving average (MA) is a line plotted on a price chart that represents the average closing price of an asset over a specified number of past periods. As each new candle closes, the oldest data point drops off and the newest is added, the average moves forward in time with the chart.
If you are looking at a 20-period moving average on a daily chart, it shows you the average closing price of the last 20 trading days. On a 5-minute chart, it shows the average closing price of the last 20 five-minute candles. The period is the same; the timeframe changes the context entirely.
The result is a smooth, flowing line that cuts through the noise of raw price and reveals the underlying trend.
Key principle: A moving average does not predict where price is going. It tells you, with mathematical clarity, where price has been, and that context is often enough to make a high-probability decision.
The Two Moving Averages Every Trader Must Know
Simple Moving Average (SMA)
The Simple Moving Average gives equal weight to every data point in the period. To calculate a 5-period SMA, you add the last five closing prices and divide by five. Every day counts the same, the close from five days ago carries as much weight as yesterday’s close.
Example, 5-Day SMA on a stock priced around $100:
| Day | Closing Price |
|---|---|
| 1 | $98.00 |
| 2 | $99.50 |
| 3 | $101.00 |
| 4 | $100.50 |
| 5 | $102.00 |
SMA = ($98.00 + $99.50 + $101.00 + $100.50 + $102.00) ÷ 5 = $100.20
The plotted point for Day 5 is $100.20. On Day 6, Day 1 drops off and the newest close is added. The line moves forward.
SMAs are slower and smoother. They are better at identifying the long-term trend and acting as clean, well-respected support and resistance levels. The 50-day and 200-day SMAs are among the most watched technical levels in all of finance, institutional traders, hedge funds, and algorithmic systems all reference them.
Exponential Moving Average (EMA)
The Exponential Moving Average applies a multiplier that gives more weight to recent prices and less weight to older ones. The formula is more complex, but the principle is simple: what happened yesterday matters more than what happened two weeks ago.
This makes the EMA faster and more reactive. It hugs price more tightly, turns sooner, and responds to new information more quickly. For day traders working off 5-minute or 15-minute charts, the EMA is the preferred tool because they need signals in near real-time, not a smoothed history lesson.
The trade-off: because the EMA is more sensitive, it generates more false signals in choppy, sideways markets. Speed has a cost.
Which Should You Use?
| SMA | EMA | |
|---|---|---|
| Best for | Swing trading, position trading | Day trading, scalping |
| Signal speed | Slower | Faster |
| False signals | Fewer | More in sideways markets |
| Most common settings | 50, 100, 200 | 9, 13, 20, 21, 50 |
| Institutional relevance | Very high (50/200 day) | High (intraday) |
The GPS Analogy: Why Moving Averages Make Sense
Imagine you are driving from Dallas to Denver. Your GPS does not show you every bump in the road, every pothole, every lane change made by other drivers. It shows you the route, the broad direction of your journey filtered through a coherent algorithm.
A moving average is that GPS line for price.
The individual candles are the potholes and lane changes, real, but irrelevant to the destination. The moving average is the road itself. When price is above the moving average and the line is pointing upward, you are heading north. When price breaks below a rising moving average and the line begins to flatten or curl downward, your GPS is recalculating. Something in the underlying direction has changed.
Just like GPS, a moving average will not tell you about a detour that does not exist yet. But it will tell you, with remarkable accuracy, which way the road is currently heading, and that is usually enough.
Moving Averages in Action: Three Core Applications
1. Trend Direction Filter
The simplest and most powerful use: is price above or below the moving average?
- Price consistently above a rising 50-day SMA → uptrend. Look for long (buy) setups only.
- Price consistently below a falling 50-day SMA → downtrend. Look for short (sell) setups only or stay out.
This single filter eliminates a massive category of bad trades. Trading against the moving average direction, buying in a downtrend, shorting in an uptrend, is one of the most common and costly mistakes new traders make.
2. Dynamic Support and Resistance
In a strong trend, moving averages act like a floor (in an uptrend) or a ceiling (in a downtrend) that price gravitates back to after extended moves.
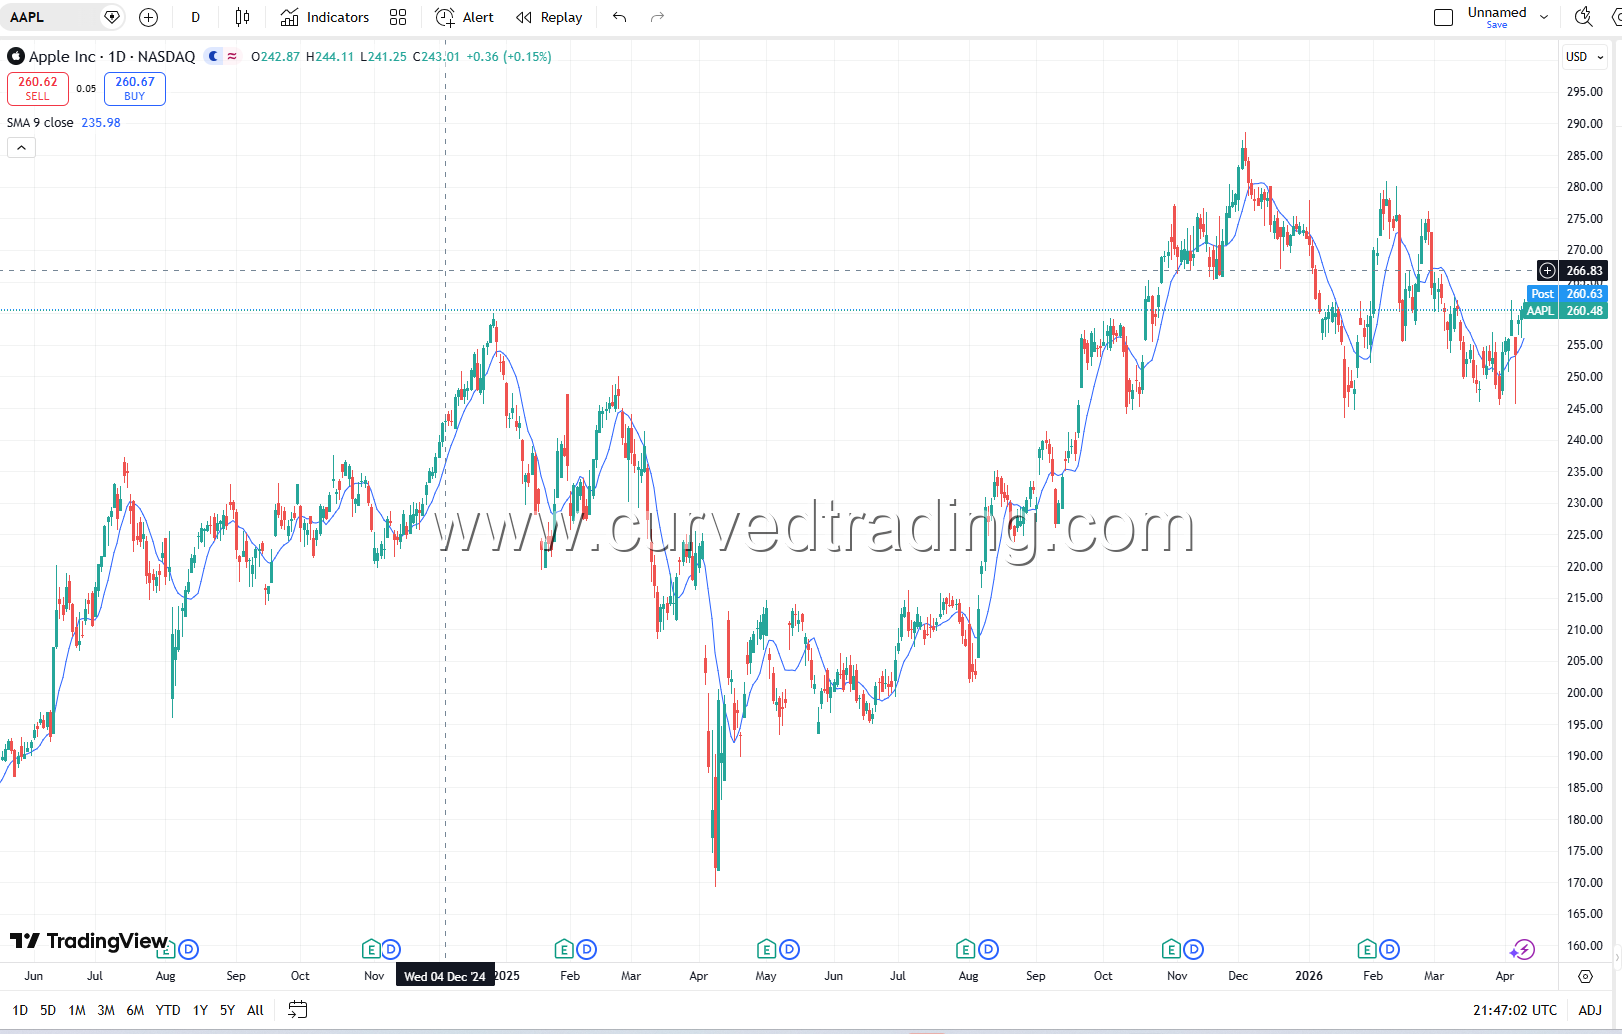
Example: AAPL is in a strong uptrend and has respected the 21-day EMA on every pullback for six weeks. Each time price dips to the EMA line, buyers step in aggressively and the stock bounces. That EMA is not a coincidence, it represents where the momentum traders and institutional algos are programmed to add exposure. You are buying where the smart money is already positioned.
The same logic applies in reverse. A stock in a downtrend that repeatedly fails at the 20-day EMA on every bounce, that line is active resistance. Sellers are defending it.
3. The Moving Average Crossover, Golden Cross and Death Cross
When two moving averages of different lengths are plotted together, their intersection creates some of the most widely followed signals in all of technical analysis.
The Golden Cross:
- The 50-day SMA crosses above the 200-day SMA.
- Signals a major shift from bearish to bullish trend.
- Historically associated with the beginning of sustained uptrends in indexes like SPY and QQQ.
- Media, institutional analysts, and retail traders all watch for this signal, which means it becomes self-fulfilling to a degree.
The Death Cross:
- The 50-day SMA crosses below the 200-day SMA.
- Signals a major shift from bullish to bearish trend.
- Often precedes extended downtrends or accelerated selling pressure.
Important nuance: Crossovers are lagging signals, by definition, they confirm a trend that is already underway. They are most valuable as confirmation tools, not as entry triggers in isolation. A Golden Cross in NVDA after a prolonged downtrend confirms the turn is real, but the best entries were available weeks before the cross occurred.
A Real-World Trade Setup Using Moving Averages
Scenario: You are watching AMD on a daily chart. The stock has been in a healthy uptrend for three months. You want to find a quality pullback entry.
Step 1, Confirm the trend. The 21-day EMA is above the 50-day SMA. Both lines are sloping upward. AMD is in a clear uptrend. You will only look for long (buy) entries.
Step 2, Wait for the pullback. AMD runs from $165 to $178 over two weeks, then begins to pull back. Price dips toward the 21-day EMA, which is sitting at approximately $168.
Step 3, Watch price behavior at the EMA. Does price slice through the EMA on high volume (bad, suggests trend is weakening)? Or does it tap the EMA on declining volume and show a rejection candle, a hammer, a doji, a bullish engulfing (good, trend is healthy and buyers are defending)?
Step 4, Enter on confirmation. You see a hammer candle close at $168.50, right at the 21-day EMA, on the lowest volume of the pullback. The next session opens and price pushes back above $170 in the first 30 minutes. You enter at $170.25, place your stop at $167 (below the EMA), and target the prior high at $178.
Step 5, Manage with the moving average. As AMD trends higher, the 21-day EMA rises with it. You trail your stop to just below the EMA on each weekly close. When price finally breaks below the EMA on significant volume, you exit. The moving average told you when the trade was alive and when it was over.
This is not complicated. It is patient and disciplined, which is exactly what moving averages reward.
Common Mistakes Traders Make with Moving Averages
Using too many at once. Five moving averages on a single chart create paralysis, not clarity. Start with two: one fast, one slow. Master those before adding anything.
Treating them as exact price levels. A moving average is a zone of interest, not a precise line in the sand. Price regularly wicks through an EMA by a few cents before reversing. Give it room.
Using the same settings for every timeframe. A 200-day SMA is a major institutional benchmark on a daily chart. On a 1-minute chart, it is meaningless. Match your MA settings to your timeframe and trading style.
Ignoring the broader context. A moving average does not know whether a stock is about to report earnings or whether the Fed just surprised the market with a rate decision. Always layer price context, news, volume, market structure, on top of your MA signals.
Closing Thoughts: Simplicity Is the Edge
The most sophisticated hedge funds in the world still use 50-day and 200-day moving averages as reference points. Not because they are magic. But because enough participants respect them to make them significant. That collective belief gives them power.
For a new trader, moving averages provide something rarer than a perfect signal: clarity. They cut through the noise, tell you which way the wind is blowing, and give you a structured framework for entries, exits, and trend filtering.
Learn one moving average well. Use it consistently. Let it do what it was built to do, smooth the road and show you the direction. The rest of trading is patience.
Ready to see this in action? Watch our Level 2 + Moving Average combo breakdowns in the Discord.