Why Is the Stock Market Going Down?
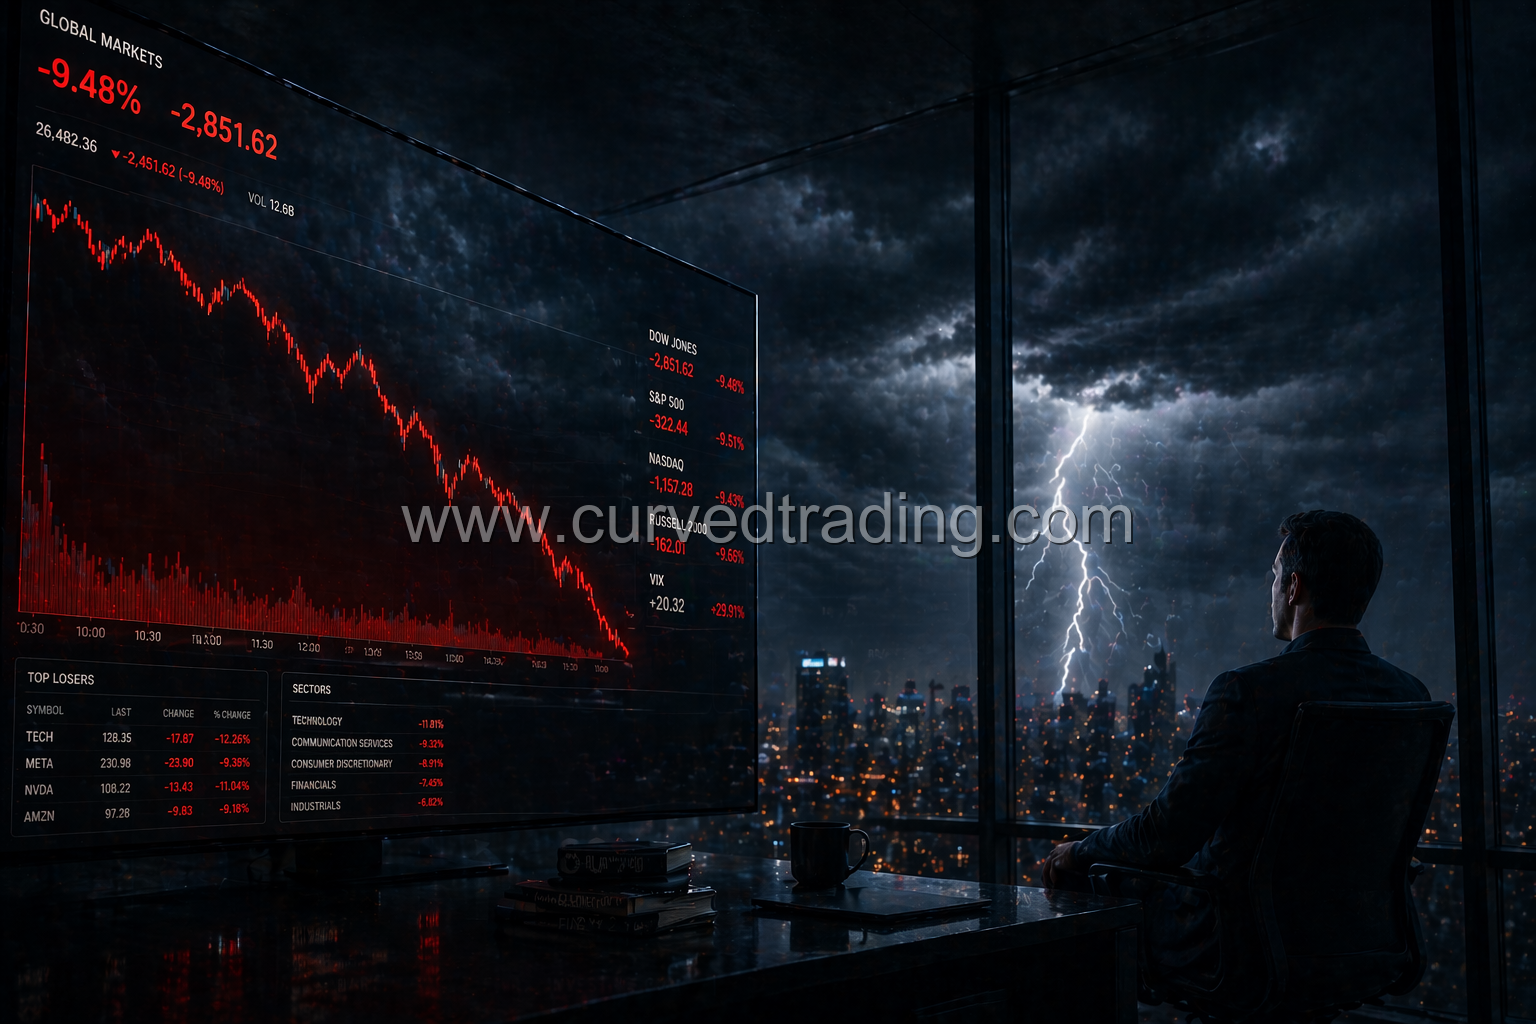
Weather systems do not ask permission. A storm does not care about your vacation plans, your portfolio, or your retirement timeline. It arrives when atmospheric conditions are right, runs its course, and passes. The meteorologist’s job is not to stop the storm — it is to read the conditions, communicate what is coming, and help people prepare.
Experienced traders treat market selloffs the same way. The market does not care about your cost basis. It does not care that you bought NVDA at $150 or that you are down 30% on a position you were certain about. What it responds to — the only thing it responds to — is the collective behavior of every buyer and seller in it at any given moment.
This guide explains why markets fall, how to read a falling market using real tools, what to do with your positions, and how the traders who come out ahead of market crashes actually think.
Why Does the Stock Market Go Down?
Markets fall for one fundamental reason: more sellers than buyers at current prices. Everything else — economic data, Fed decisions, geopolitical events, earnings reports — is simply a catalyst that shifts the balance.
Macroeconomic Shifts
The largest, most sustained market declines are almost always rooted in macroeconomic change. Interest rates, inflation, employment trends, and GDP growth determine the discount rate markets apply to future earnings.
The most important relationship in markets: When interest rates rise, the present value of future earnings falls. This is why Federal Reserve decisions move markets more than almost any other single factor. When the Fed raised rates aggressively in 2022 to combat inflation, the S&P 500 fell approximately 25% — not because companies suddenly became less profitable, but because the discount rate applied to their future earnings increased significantly.
In 2025–2026, broad tariff escalations between the United States and major trading partners — China, the EU, and Canada — introduced a new layer of macroeconomic uncertainty. Supply chain disruption, margin compression in import-dependent industries, and inflation risk from tariffs on consumer goods contributed to significant market volatility. When headlines say “markets are down on tariff fears,” this is the mechanism: uncertainty about future earnings in a tariff-affected supply chain gets priced in immediately.
Earnings Disappointments
Individual stock declines driven by earnings misses can spread into sector-wide and market-wide selloffs when the disappointing company is large enough or when the miss signals a broader industry trend. When a major bank misses on loan growth, the entire financial sector re-prices. When a bellwether retailer cuts guidance, consumer discretionary stocks broadly sell off.
Liquidity Events and Forced Selling
Sometimes markets fall not because fundamentals changed but because large participants are forced to sell — margin calls, fund redemptions, risk limit breaches. This is the long squeeze mechanic covered in our short squeeze guide: leveraged positions getting force-liquidated create cascading selling that has nothing to do with fundamental value.
The March 2020 COVID crash is the clearest recent example. Stocks fell 35% in 33 days — not primarily because earnings collapsed instantly, but because forced selling from leveraged positions created a liquidity crisis that overwhelmed buyers.
Sentiment and Momentum
Markets are not purely rational. Fear is contagious. When investors see their portfolios declining, the instinct to sell to “stop the bleeding” is powerful — even when selling locks in losses that might recover. The irony: fear-driven selling creates the very crash it was trying to avoid, as sellers overwhelm buyers at successively lower prices.
This is why professional traders say “the crowd is wrong at extremes.” When retail selling is at its most intense — when everyone is searching “is the market going to crash?” — the market is frequently near a bottom.
How to Read a Falling Market With Technical Tools
Panic does not need charts. Discipline does. Here are the technical tools experienced traders use to assess falling markets.
The 200 EMA — The Long-Term Line in the Sand
The 200-day Exponential Moving Average is the most-watched level in all of equity markets. Institutions, algorithmic systems, and professional traders treat it as the dividing line between long-term bull and bear territory.
- Price above 200 EMA: Long-term uptrend intact. Declines are corrections.
- Price below 200 EMA: Long-term downtrend confirmed. Rallies are suspect until reclaimed.
During selloffs, watch how price interacts with the 200 EMA on the S&P 500 (SPY) and Nasdaq (QQQ). A decisive close below it changes the macro picture. A reclaim — especially on strong volume — is one of the most reliable recovery signals in technical analysis.
RSI at the Extremes — When Fear Becomes Opportunity
When the RSI on the daily S&P 500 chart drops below 30, the market is in statistically rare oversold territory. As covered in our RSI guide, this does not automatically mean buy — oversold markets can stay oversold during genuine bear markets. But RSI readings below 25 on the weekly S&P 500 chart have historically preceded significant recoveries. The 2009, 2020, and 2022 lows all produced RSI extremes that, in retrospect, were generational buying opportunities.
Bollinger Band Width — Measuring the Panic
During severe selloffs, Bollinger Bands expand dramatically as volatility explodes. When the bands reach their widest point and begin to contract — when volatility exhausts itself — it often signals that the worst of the selling is over. The contracting band width after a crash expansion is one of the earliest technical signals of stabilization.
VWAP on the Intraday — Where Institutions Are Buying
During market crashes, VWAP becomes even more important as an institutional reference. Large funds deploying capital during selloffs anchor their buying to VWAP. Watching how the market behaves relative to VWAP during intraday recovery attempts tells you whether institutional money is actually coming in or whether the bounce is purely retail-driven and therefore fragile.
Is This a Crash or a Correction?
Not every decline is a crash. The appropriate response is different for each.
| Category | Decline | Typical Duration | Response |
|---|---|---|---|
| Pullback | -5% to -10% | Days to weeks | Normal. Do nothing unless overexposed. |
| Correction | -10% to -20% | Weeks to months | Reassess. Opportunity if thesis intact. |
| Bear Market | -20%+ | Months to years | Structural change. Risk management critical. |
| Crash | -20%+ rapidly | Days to weeks | Liquidity event. Volatility extreme. |
The S&P 500 has historically experienced a 10%+ correction roughly once per year on average. Bear markets occur roughly once every 3–5 years. Full crashes are rarer — 1987, 2000–2002, 2008–2009, and 2020 are the modern examples.
Should You Sell Your Stocks?
This is the question that drives 50,000 searches a month when markets are falling. The honest answer is individual — but here are the principles.
The Case for Not Selling
Time is the most powerful force in investing. The S&P 500 has recovered from every single decline in its history — including the Great Depression, the 2008 financial crisis, and the COVID crash — and gone on to make new all-time highs. Investors who sold at the bottom of the 2020 crash (-35%) missed a 100% recovery that followed over the next 18 months.
Selling during a decline crystallizes a loss that may have recovered. It also creates a second, harder decision: when to get back in. Most investors who sell during crashes buy back after the recovery has already happened — selling low and buying high, the exact opposite of the intended strategy.
If your investment thesis has not changed — if the reason you owned the stock is still valid — selling during a temporary decline is almost always the wrong decision.
The Case for Selling
There are legitimate reasons to sell during a declining market:
The thesis has changed. A company’s fundamentals have deteriorated, management has misled shareholders, or a secular industry shift makes recovery unlikely on any relevant timeline.
Position sizing is wrong. You are in more risk than you can emotionally or financially sustain. A position so large you cannot sleep needs to be reduced — not because the timing is right, but because your risk exposure is structurally too high.
You have a near-term cash need. If you need this money within 1–3 years for a house, tuition, or retirement, equity exposure at the wrong time creates real financial risk.
The technical picture has broken. For active traders: if a position has violated its stop loss, the 200 EMA has decisively broken, and sector momentum has completely reversed — the trade is wrong. Exit. Trade your plan, not your hope.
Major Market Crashes — What Actually Caused Them
2008 — The Housing Crisis
Mortgage-backed securities built on subprime loans collapsed when housing prices fell. Banks holding these instruments became insolvent or near-insolvent. Credit markets froze. The S&P 500 fell 57% peak to trough over 17 months.
2020 — The COVID Crash
The fastest 30%+ decline in market history — 33 days from peak to trough. Driven by forced selling, liquidity events, and genuine economic uncertainty. Recovered fully within five months.
2022 — The Rate Shock
The most aggressive Federal Reserve tightening cycle in 40 years. Fed funds rate rose from 0.25% to 5.5% in 18 months. Growth stocks valued on discounted future earnings took the worst hits. Nasdaq fell approximately 35%.
2025 — Tariff Turbulence
The reintroduction of broad tariffs on imports from major trading partners in early 2025 created the sharpest market volatility since 2022. Technology hardware, consumer goods, and automotive sectors — all with heavy import exposure — experienced the largest drawdowns. The uncertainty around retaliatory tariffs and supply chain restructuring costs remains a headwind as of mid-2026.
The Trader’s Mindset During a Crash
The traders and investors who come out ahead of market crashes share behavioral traits worth studying.
They have a plan before the crash hits. Stop loss levels, position sizing rules, and rebalancing triggers are set when markets are calm — not when they are in freefall. Decisions made during extreme fear are almost never optimal.
They watch for short squeeze dynamics. Crashes concentrate short interest. The violent recoveries that often follow crash lows are partly driven by shorts covering — creating explosive upside for those positioned correctly. Our short squeeze guide covers how to identify this dynamic.
They use indicators, not emotions. When RSI on the weekly S&P hits 25 and Bollinger Bands are at maximum expansion, that is not a time to panic. That is a time to reference history, review your thesis, and consider whether the data supports adding risk.
They know their statistics. As covered in our day trading statistics guide, the traders who fail during volatile markets are overwhelmingly the ones who traded on emotion rather than framework. Structure survives volatility. Emotion does not.
Final Thought: The Storm Always Passes
Every person who has ever asked “is the stock market going to crash?” during a market decline has eventually witnessed the recovery. Not because recoveries are guaranteed in individual names — they are not — but because the aggregate of human economic activity, productivity, and innovation trends upward over time.
The market falls. It recovers. The traders who profit from both directions understand the tools that read the conditions, the discipline to act on analysis rather than fear, and the patience to let the storm run its course.
Read the indicators. Trust your plan. Know that this — whatever this specific decline is — has happened before. And the market came back.