What Is a Blue Chip Stock?
In real estate, location is everything. A property on Fifth Avenue in Manhattan, Rodeo Drive in Beverly Hills, or Mayfair in London maintains its value through recessions, crises, and market cycles in ways that outlying properties do not. These are not the fastest-appreciating assets at every moment — but they are the ones that institutions, family offices, and generational wealth concentrate in because they have proven, over decades, that they survive and recover.
Blue chip stocks are the Fifth Avenue properties of the equity market.
The term “blue chip” comes from poker — blue chips carry the highest value at the table. Applied to stocks, it describes companies that are large, established, financially stable, and dominant in their industries. They are not the fastest movers. They are the survivors. And in a market full of volatility, the ability to survive and recover while paying dividends along the way is worth more than most investors appreciate.
The Defining Characteristics of a Blue Chip Stock
There is no formal regulatory definition of “blue chip” — it is a qualitative assessment based on a set of consistent characteristics. A genuine blue chip stock typically has:
Market capitalization above $10 billion, usually significantly higher. Most blue chips are in the $50 billion to $3+ trillion range.
A long operating history — typically 20+ years as a public company, with a track record across multiple economic cycles. A company that has navigated the 2001 dot-com crash, the 2008 financial crisis, the 2020 COVID crash, and the 2022 rate shock has proven structural resilience.
Industry leadership — dominant market share, recognizable brand, significant competitive moat (barriers to entry that protect their business from competition).
Consistent profitability — not just revenue growth, but actual sustained earnings. Blue chips are not “grow now, profit later” businesses.
Dividend payment history — many, though not all, blue chips pay dividends — and the best among them have histories of increasing dividends annually for decades. Companies that have raised dividends for 25+ consecutive years are called Dividend Aristocrats. Those with 50+ years of consecutive increases are Dividend Kings.
Investment grade credit ratings — from agencies like Moody’s and S&P, reflecting low default risk and strong balance sheets.
Examples of Blue Chip Stocks in 2026
These are companies that broadly meet the blue chip criteria across different sectors. This is not investment advice — it is illustrative of what the category looks like.
Technology:
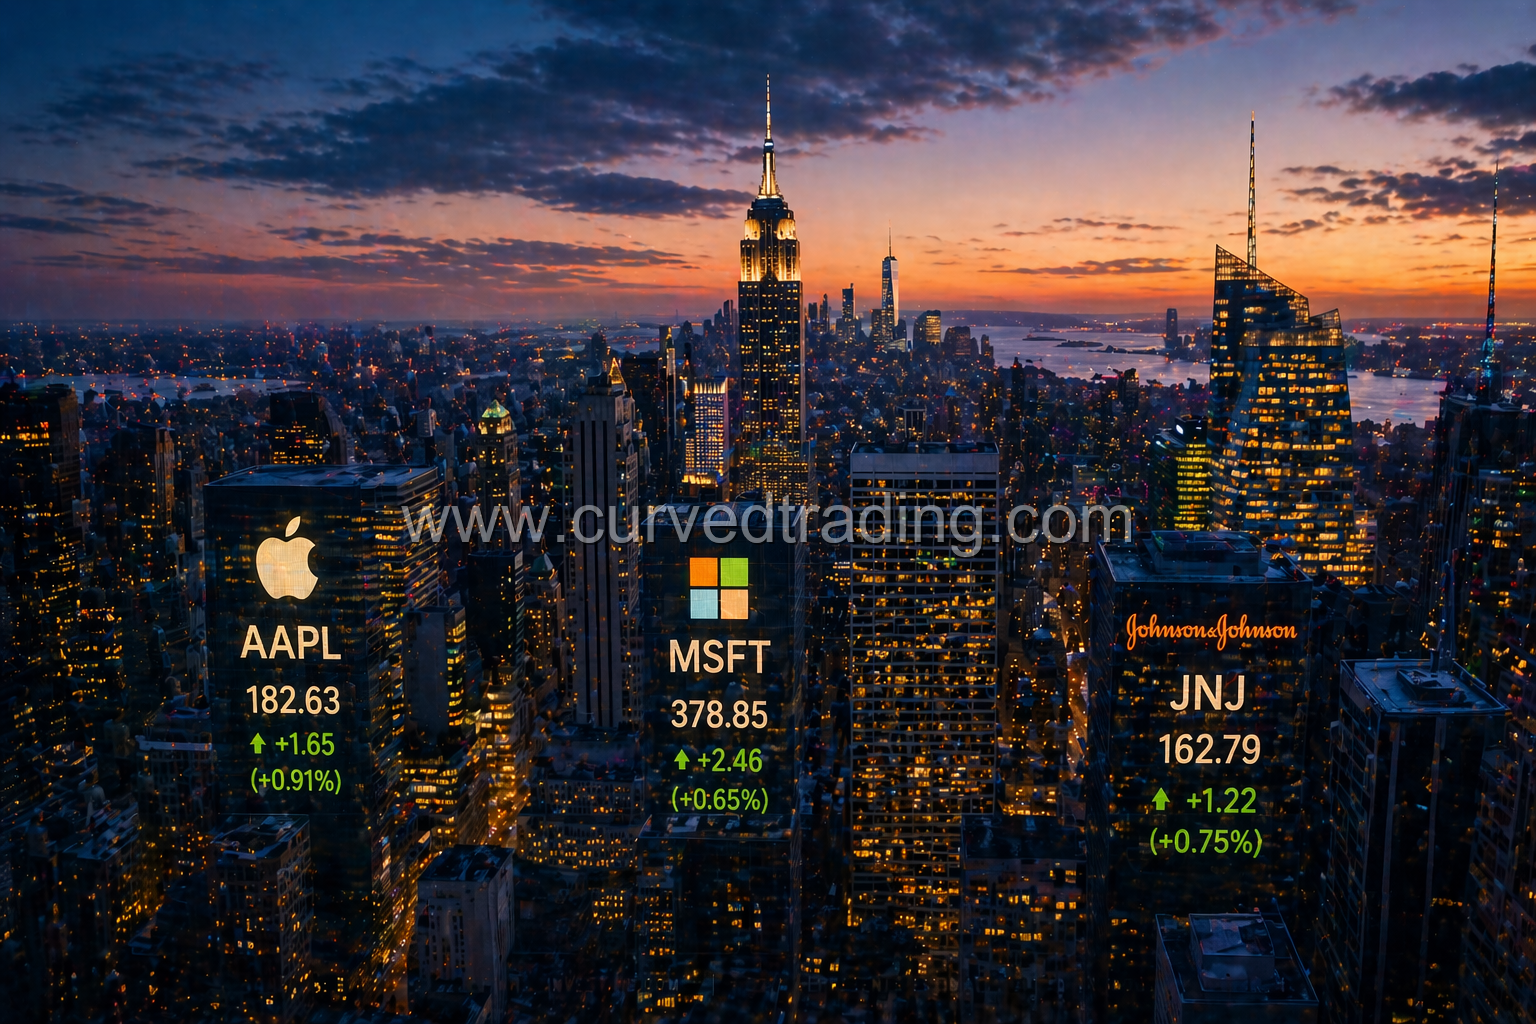
- Apple (AAPL) — The largest company in the world by market cap for much of the past decade. Generates over $100 billion in annual free cash flow. Pays a dividend and runs one of the most aggressive share buyback programs in history.
- Microsoft (MSFT) — 49 consecutive years of dividend increases. Dominant positions in cloud computing (Azure), enterprise software (Office 365), and AI infrastructure (OpenAI partnership).
Financial Services:
- JPMorgan Chase (JPM) — The largest U.S. bank. Led by Jamie Dimon, who has navigated the institution through every major financial event of the past two decades. Consistent dividend payer with significant capital return programs.
- Visa (V) — Not a bank but a payments infrastructure company. Asset-light, extraordinarily high margins, global network effects. Has raised its dividend every year since going public.
Consumer Staples:
- Procter & Gamble (PG) — A Dividend King with 68+ consecutive years of dividend increases (as of 2026). Brands include Tide, Pampers, Gillette, and dozens of others. Consumer staples are defensive — people buy soap and diapers regardless of what the market is doing.
- Johnson & Johnson (JNJ) — Another Dividend King. Diversified across pharmaceuticals, medical devices, and consumer health. Among the most stable large-cap stocks in the world.
Industrial:
- Caterpillar (CAT) — Global leader in construction and mining equipment. Dividend Aristocrat. Benefits from infrastructure spending cycles globally.
Healthcare:
- UnitedHealth Group (UNH) — Largest health insurer in the United States. Consistent revenue growth driven by the structural demand of an aging population.
Blue Chip Stocks That Pay Dividends
Dividends are one of the most powerful aspects of blue chip investing. A dividend is cash paid directly to shareholders — typically quarterly — as a share of the company’s earnings. Blue chip dividends do three things that matter enormously to long-term investors:
They compound. Reinvesting dividends over 20–30 years dramatically outperforms price appreciation alone. Studies consistently show that reinvested dividends account for 40–50% of total stock market returns over long periods.
They signal strength. A company that consistently pays and raises its dividend is demonstrating financial discipline. It cannot fake this — dividends require actual cash, not accounting adjustments.
They cushion downturns. During market selloffs like the ones covered in our stock market crash guide, dividend income continues even when prices fall. This psychological and financial cushion helps long-term investors stay invested through volatility.
Dividend metrics to understand:
- Dividend Yield: Annual dividend ÷ current stock price. A 3% yield on a $100 stock means $3 paid annually per share. Higher is not always better — an abnormally high yield can signal a dividend at risk of being cut.
- Payout Ratio: Dividends paid ÷ earnings. Below 60% is generally sustainable. Above 80% may indicate the dividend is stretching the company’s financials.
- Dividend Growth Rate: How much the dividend has increased annually over 5 or 10 years. Companies growing dividends 5–10% annually are compounding investor income meaningfully.
How to Choose Stocks to Invest In
Beyond blue chips specifically, this is the framework thoughtful investors use to evaluate any stock.
Step 1 — Understand the Business
Before looking at a chart or a valuation metric, understand what the company actually does. How does it make money? Who are its customers? What would cause them to stop buying? A business you can explain in two sentences is a business you can analyze properly.
Warren Buffett’s famous “circle of competence” principle: only invest in businesses you understand well enough to predict their direction over 5–10 years. If you cannot do that, the investment is speculation, not analysis.
Step 2 — Assess the Competitive Moat
Why can this company maintain its profitability against competition? The strongest moats are: network effects (the product gets more valuable as more people use it — Visa, Microsoft), switching costs (it is painful or expensive to leave — enterprise software, banks), cost advantages (can produce at lower cost than any competitor — Walmart, Costco), and brand strength (customers pay premiums because of brand trust — Apple, Coca-Cola).
Step 3 — Check the Financials
The three numbers that matter most for fundamental stock selection:
Revenue growth: Is the top line growing consistently? Stagnant revenue in an expanding economy is a warning sign.
Earnings per share (EPS) growth: Are profits growing faster than revenue? Improving margins signal operational leverage.
Free cash flow: Cash generated after capital expenditures. This is the money available for dividends, buybacks, debt repayment, and acquisitions. Free cash flow is harder to manipulate than reported earnings and is the truest measure of a business’s financial health.
Step 4 — Understand the Valuation
A great business at the wrong price is a bad investment. Key valuation metrics:
Price-to-Earnings (P/E): Stock price ÷ earnings per share. Compare to the company’s historical average, its sector peers, and the broader market. A P/E of 35 in a sector where peers trade at 20 demands justification.
Price-to-Free-Cash-Flow: Often more reliable than P/E. Divide market cap by annual free cash flow to understand how much you are paying for each dollar of cash the business generates.
PEG Ratio: P/E ÷ earnings growth rate. A P/E of 25 on a company growing earnings 25% annually (PEG of 1.0) is very different from a P/E of 25 on a company growing at 5% (PEG of 5.0).
Step 5 — Read the Technical Picture
Even for long-term investors, entry timing matters. Use the EMA to confirm trend direction before initiating a position. A stock in a confirmed downtrend — price below a declining 200 EMA — is better bought when the trend reverses than at a “discount” that continues to get cheaper. The RSI can signal when a quality stock is in genuinely oversold territory — often the best long-term entry points.
When Should You Sell a Stock?
Knowing when to buy is half the equation. Knowing when to sell is the harder, more important half.
Sell When the Thesis Is Broken
You bought the stock for a reason — a competitive advantage, a growth catalyst, a valuation opportunity. If that reason no longer exists, the justification for holding is gone. Do not hold a stock out of loyalty to your original decision. The market does not care about your cost basis.
Sell When Better Opportunities Exist
Opportunity cost is real. Capital tied up in a mediocre business is capital not deployed in a better one. Periodically review your holdings: is there a more compelling use of this capital right now?
Sell to Rebalance
If a single position has grown to represent an uncomfortably large percentage of your portfolio — through appreciation, not just purchase — trimming it back to a target allocation is prudent risk management, not market timing.
Sell at Technical Targets
For active investors and traders, having pre-defined price targets creates discipline. When a stock reaches your target, take at least partial profits. Let a trailing stop handle the remainder. This locks in gains without requiring you to perfectly time the top.
When Not to Sell
Do not sell because the market is down, the news is scary, or you feel anxious. These are emotional responses, not analytical ones. As covered in our market crash guide, the majority of investors who sell during panic periods sell at exactly the wrong time.
Do not sell a great business because of a bad quarter. One earnings miss from a fundamentally strong company with an intact moat is noise. A pattern of misses, declining margins, and management turnover is signal.
Blue Chips During Market Crashes — How Do They Perform?
Blue chip stocks are not immune to market crashes. During the 2020 COVID crash, even the highest quality companies fell 20–40%. But three things distinguish blue chip behavior during downturns:
They fall less than the market. In 2022, while the Nasdaq fell 35%, Procter & Gamble was down approximately 7%. Johnson & Johnson was roughly flat. The defensive characteristics of blue chips — stable earnings, dividend income, strong balance sheets — insulate them from the worst of the selling.
They recover faster. Institutional capital that fled into cash during panics flows back into blue chips first. The price discovery is faster because the fundamentals are clearer.
They pay you while you wait. Dividends continue through market downturns. An investor holding a 3% yield blue chip during a 20% market decline is still collecting income — softening the real economic impact of the paper loss.
This combination of drawdown protection, faster recovery, and dividend income is precisely why blue chips anchor the portfolios of endowments, pension funds, and generational wealth structures.
Final Thought: Blue Chips Are Not Exciting. That Is the Point.
The traders who captured 300% returns in meme stocks during 2021 made the news. The investors who held Apple, Microsoft, and Johnson & Johnson through 2020, 2021, 2022, and 2025 built quiet, compounding, generational wealth while nobody wrote articles about them.
Both approaches can work. But only one of them lets you sleep at night, collects dividends while you wait, and has a 100-year track record of eventually making new all-time highs.
Understand your business. Buy at a fair price. Hold through the noise. Sell when the thesis breaks.
That is it. That is the entire framework that has worked for the wealthiest long-term investors in history. It is not complicated. It is just difficult.