The Real Numbers Behind Day Trading
The Olympics do not hide their statistics. Thousands of athletes qualify. Hundreds make finals. A handful win medals. A smaller handful become generational legends. Nobody suggests the sport is a scam because most competitors do not win gold.
Day trading deserves the same honest framing. The numbers are what they are — and understanding them separates the traders who approach this with realistic expectations from those who enter with fantasy.
How Many Day Traders Are There in the World?
Precise global figures are difficult to verify — regulators in different countries track retail activity differently, and many retail traders operate without formal classification. However, research and brokerage data paint a reasonable picture.
Estimated global retail day traders: 13–15 million (2025–2026 estimates)
The breakdown by region:
- United States: Approximately 3–4 million active retail day traders
- Asia (India, China, Japan, South Korea): The largest concentration globally — India alone has seen explosive retail trading growth following the post-COVID brokerage boom, with Zerodha and Groww reporting tens of millions of active users, a significant subset of whom day trade
- Europe: Estimated 1–2 million across major markets
- Latin America: Growing rapidly, particularly Brazil (which also has the most-studied retail trading data in the world)
The COVID-19 pandemic accelerated retail trading participation dramatically. Stimulus payments, zero-commission apps like Robinhood, and market volatility in 2020–2021 brought an estimated 10–15 million new retail accounts to U.S. brokerages in an 18-month period.
What Percentage of Day Traders Are Profitable?
This is the most important statistic in this entire guide, and the most frequently distorted one.
The academic consensus: approximately 1–20% of day traders are consistently profitable over multi-year periods, depending on how “profitable” is defined and over what timeframe.
The most cited research:
The Brazil Study (Chague, Giovannetti, and De-Losso, 2020) tracked all individuals who began day trading in the Brazilian equities futures market (the mini-Ibovespa contract) between 2013 and 2015. After a two-year period:
- 97% of traders who persisted for more than 300 days lost money
- Less than 1% earned more than the Brazilian minimum wage from trading
- Only 0.4% earned more than a bank teller’s salary
The Taiwan Market Study (Barber, Lee, Liu, Odean, 2014) examined 15 years of data from the Taiwan Stock Exchange:
- Less than 1% of retail day traders were consistently profitable over multiple years
- The majority of profitable trading was concentrated among a very small group of repeat, experienced traders
FINRA and SEC retail investor research in the U.S. consistently finds that the majority of active retail traders underperform passive index investing after fees and taxes.
The nuance: These studies focus on consistent, multi-year profitability. Shorter windows show higher success rates. Many traders have profitable months, quarters, or even single years — the challenge is sustaining it.
How Many Successful Day Traders Are There?
Applying the ~1–20% success rate to the estimated 13–15 million global day traders:
- Conservatively (1% threshold): ~130,000–150,000 consistently profitable day traders worldwide
- Broadly (20% threshold): ~2.6–3 million who are modestly profitable or break even over time
In the United States specifically, estimates suggest 300,000–600,000 retail traders who are consistently profitable year-over-year — representing a small but economically significant group.
The Most Famous Day Traders Who Made Millions
The legends of day trading are real. They are also outliers by multiple standard deviations.
Takashi Kotegawa — The Japanese Trader Who Made $34 Million
Kotegawa is arguably the most famous retail day trader in history. Starting with approximately $13,600 in 2000, the Japanese trader grew his account to over $34 million by 2008 — a return of roughly 250,000% — primarily trading Japanese equities. His strategy focused on buying stocks that had declined sharply, capitalizing on oversold conditions and short-term mean reversion. He became known as “BNF” in Japanese trading forums.
His story illustrates two things: extraordinary returns are mathematically possible, and exceptional traders exist. It does not illustrate what is typical.
Jesse Livermore — The Original Short Seller
Perhaps the most famous trader in history. Livermore shorted the 1906 San Francisco Earthquake-related panic and the 1929 stock market crash, reportedly making $100 million in 1929 alone (equivalent to several billion today). His biography, Reminiscences of a Stock Operator by Edwin Lefèvre, remains the most-read trading book of all time. He also went bankrupt multiple times — a reminder that even the greatest traders are not immune to the markets.
Paul Tudor Jones
Hedge fund manager who correctly predicted the 1987 Black Monday crash and made 200% returns while the market fell 30%. Jones is perhaps the defining example of what disciplined risk management and macro-level thinking can achieve. His documentary Trader (briefly available, then pulled) remains one of the most studied pieces of trading footage ever made.
Modern Retail Success Stories
The WallStreetBets era (2020–2021) produced documented cases of retail traders turning $50,000 into millions through concentrated options positions during the GameStop short squeeze. These stories are real. They are also, in most cases, the result of timing and concentration risk rather than systematic edge — and many of the same traders gave significant portions back in subsequent months.
How Many Types of Trading Are There?
Understanding the landscape matters before choosing a style.
By Time Horizon:
- Scalping — Seconds to minutes. High volume, tiny gains per trade. Requires fastest execution.
- Day Trading — Minutes to hours. All positions closed before market close.
- Swing Trading — Days to weeks. Overnight positions. Less intensive monitoring.
- Position Trading — Weeks to months. More investing than trading.
- Algorithmic/HFT — Milliseconds. Institutional only.
By Asset Class:
- Equities (stocks)
- Options
- Futures (ES, NQ, crude oil, gold)
- Forex
- Crypto
By Strategy Type:
- Momentum trading (chasing strength)
- Mean reversion (fading extremes)
- Breakout trading (entering at key levels)
- Gap trading (morning gap plays)
- Earnings trading (volatility events)
- Short squeeze hunting (catalysts + high short interest)
How Many Trading Indicators Are There?
TradingView alone hosts over 100,000 community-created indicators in its library. The number of distinct indicator methodologies is in the hundreds. Most fall into a handful of categories:
- Trend indicators: Moving averages (EMA, SMA, WMA), MACD, ADX
- Momentum oscillators: RSI, Stochastic, CCI, Williams %R
- Volatility indicators: Bollinger Bands, ATR, Keltner Channels
- Volume indicators: VWAP, OBV, MFI, RVOL
- Price structure tools: Fibonacci retracement, pivot points, support/resistance zones
Professional traders typically use 3–5 indicators at most. The research consistently shows that adding more indicators beyond a small core set does not improve performance — it creates noise and conflicting signals. The edge is not in indicators; it is in understanding what each one measures and how they interact.
How Many Trading Platforms Are There?
In the United States alone, there are over 50 regulated brokerage platforms that allow day trading. Globally, the number exceeds 200 when including international and crypto-native platforms.
The major categories:
- Commission-free retail apps: Robinhood, Webull, Public, SoFi
- Professional retail platforms: Thinkorswim, TradeStation, Interactive Brokers, Cobra
- Futures-specific: NinjaTrader, Tradovate, Sierra Chart
- Charting-focused: TradingView (integrates with multiple brokers)
- Prop firm platforms: Rithmic, Tradovate, NinjaTrader (used by funded traders)
The platform does not determine success. Our how to start day trading guide covers what actually differentiates platforms worth using.
The Data on Overtrading
One of the clearest findings in academic research on retail traders: overtrading destroys returns.
Barber and Odean’s landmark 2000 study “Trading Is Hazardous to Your Wealth” analyzed 66,000 retail brokerage accounts and found that:
- The most active traders earned an average annual net return of 11.4%
- The least active traders earned 18.5%
- Transaction costs and poor timing caused the most active traders to massively underperform passive investors
The implication: the market rewards patience and punishes activity. Every unnecessary trade is friction. Every forced trade is negative expected value.
The traders who made millions — Kotegawa, Jones, Livermore in his best periods — were not defined by how many trades they made. They were defined by when they chose not to trade.
Final Thought: The Statistics Are Not the Story
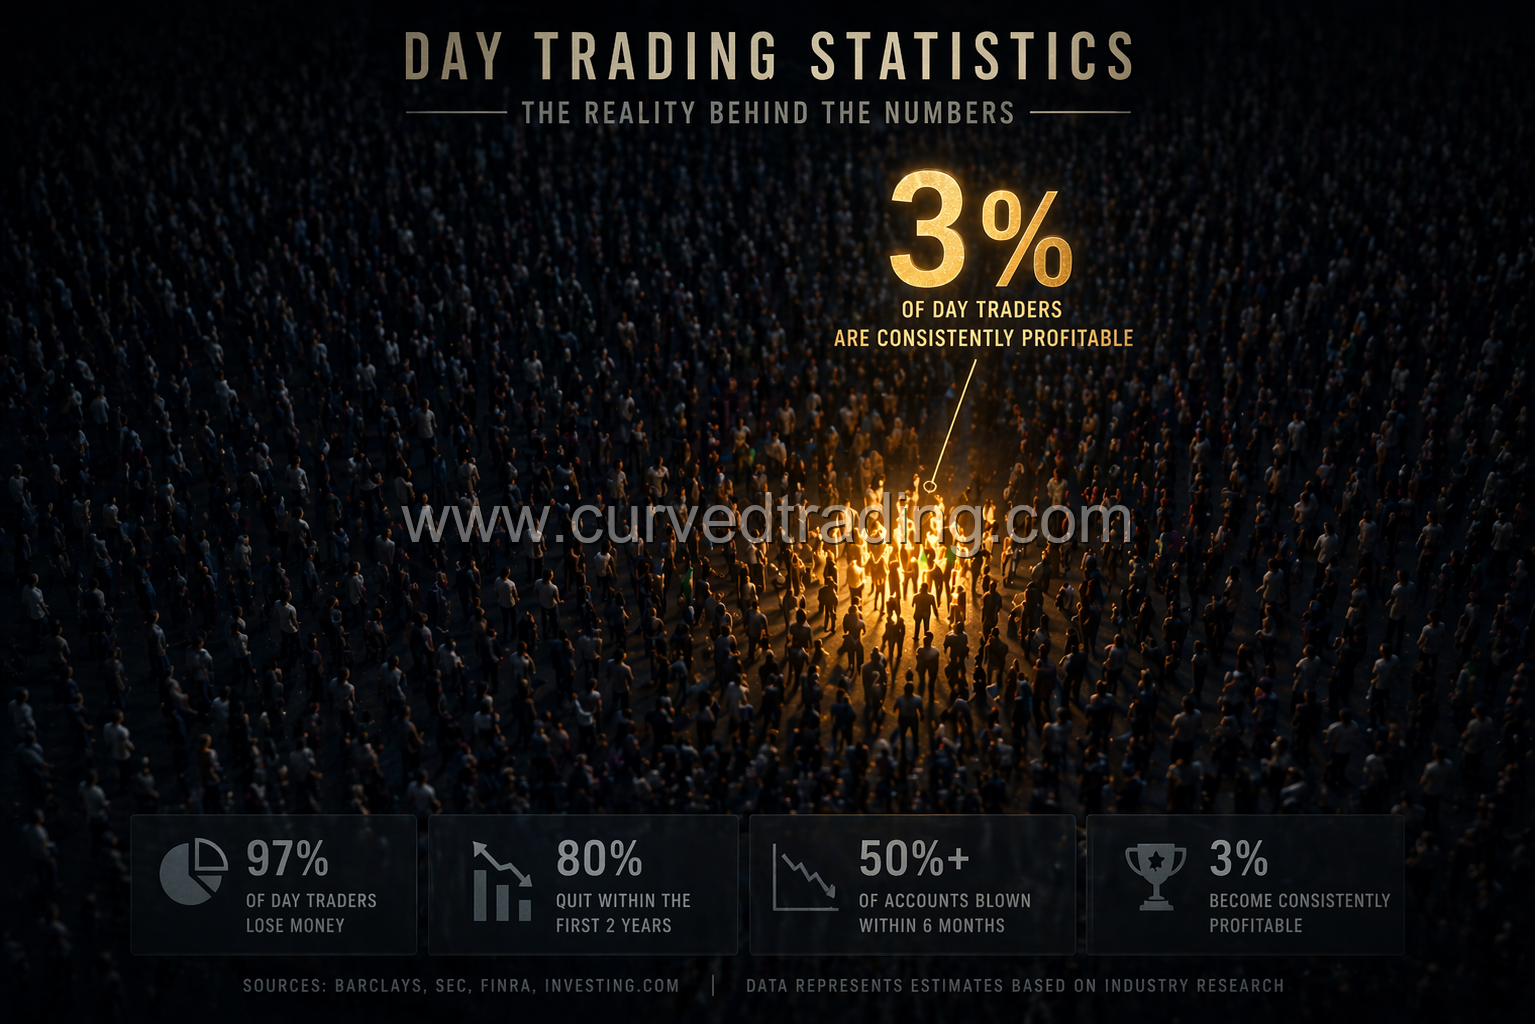
The 97% failure rate is real. So is the 3% success rate. You will find yourself in one camp or the other based on preparation, capital discipline, learning approach, and — yes — some element of timing and luck.
The statistics do not determine your outcome. They define the landscape you are navigating. Navigate it with clear eyes, proper tools, and a commitment to the process — and the odds shift in your favor.
Start with the right platform and broker. Master the indicators that matter. Understand the income reality. And give yourself enough time and capital to develop an actual edge.
That is what the successful 3% did.